Өзекті паттерндер

Прямоугольник
сформирован 04.04 в 00:05:11 (UTC+0)
сила сигнала 1 из 5
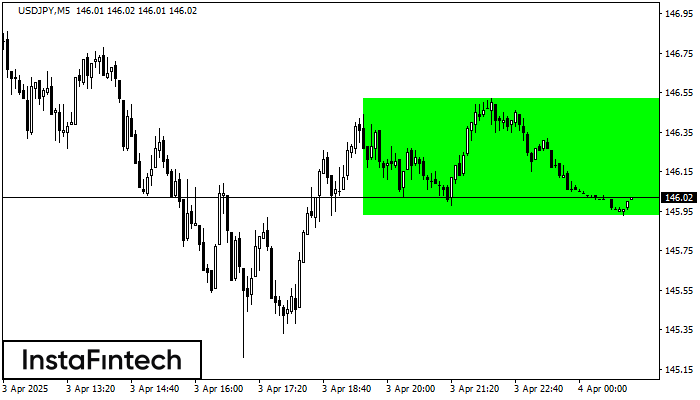
По USDJPY на M5 сформировалась фигура «Прямоугольник». Фигура данного типа относится к тому типу продолжения тренда, который содержит в себе два уровня: Сопротивление 146.52; Поддержка 145.93. В случае пробоя уровня сопротивления 146.52 возможно дальнейшее восходящее движение.
Таймфреймы М5 и М15 могут иметь больше ложных точек входа.
- Все
- Все
- Bearish Rectangle
- Bearish Symmetrical Triangle
- Bearish Symmetrical Triangle
- Bullish Rectangle
- Double Top
- Double Top
- Triple Bottom
- Triple Bottom
- Triple Top
- Triple Top
- Все
- Все
- Покупка
- Продажа
- Все
- 1
- 2
- 3
- 4
- 5
Bullish Rectangle
сформирован 24.04 в 14:47:41 (UTC+0)
сила сигнала 2 из 5
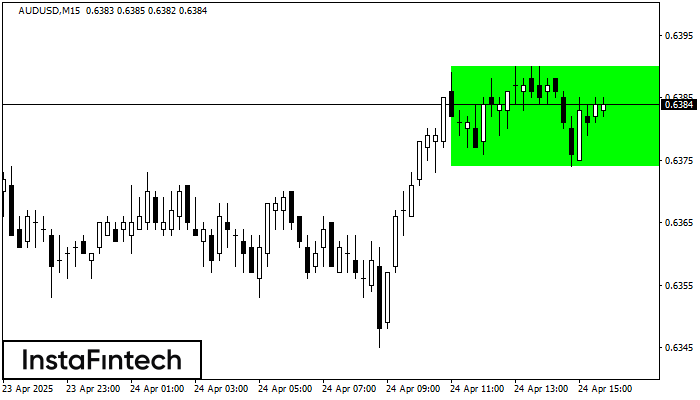
According to the chart of M15, AUDUSD formed the Bullish Rectangle which is a pattern of a trend continuation. The pattern is contained within the following borders: the lower border
The M5 and M15 time frames may have more false entry points.
Открыть график инструмента в новом окне
Double Top
сформирован 24.04 в 14:10:16 (UTC+0)
сила сигнала 1 из 5
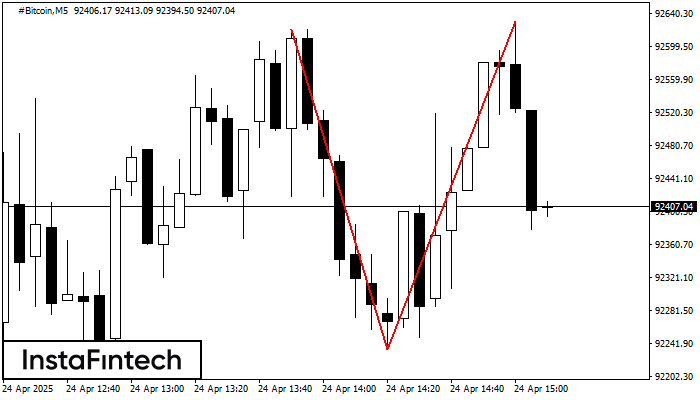
The Double Top pattern has been formed on #Bitcoin M5. It signals that the trend has been changed from upwards to downwards. Probably, if the base of the pattern 92234.22
The M5 and M15 time frames may have more false entry points.
Открыть график инструмента в новом окне
Double Top
сформирован 24.04 в 14:00:36 (UTC+0)
сила сигнала 1 из 5
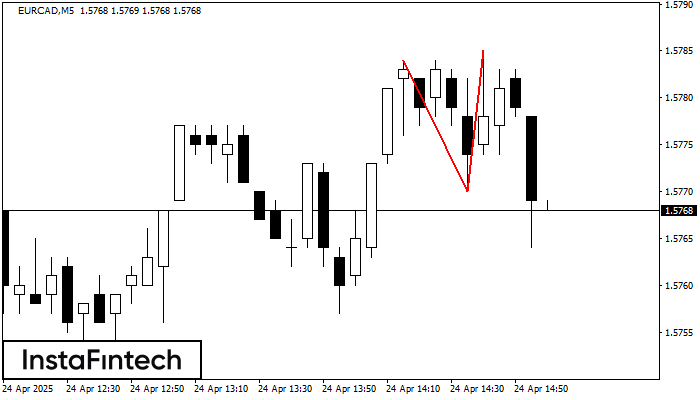
The Double Top pattern has been formed on EURCAD M5. It signals that the trend has been changed from upwards to downwards. Probably, if the base of the pattern 1.5770
The M5 and M15 time frames may have more false entry points.
Открыть график инструмента в новом окне