Двойное дно
сформирован 03.04 в 14:19:55 (UTC+0)
сила сигнала 1 из 5

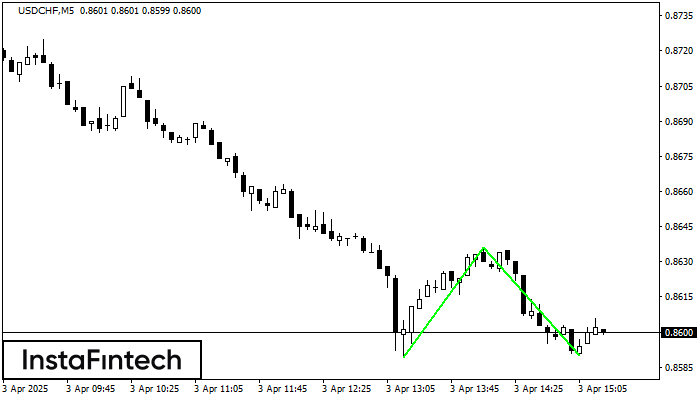
Сформирована фигура «Двойное дно» на графике USDCHF M5. Верхняя граница 0.8636; Нижняя граница 0.8590; Ширина фигуры 47 пунктов. В случае пробоя верхней границы 0.8636 можно будет прогнозировать изменение тенденции, где ширина фигуры и будет являться расстоянием предположительного Тейк Профита.
Таймфреймы М5 и М15 могут иметь больше ложных точек входа.
Сондай-ақ қараңыз
- Все
- Все
- Bearish Rectangle
- Bearish Symmetrical Triangle
- Bullish Rectangle
- Double Top
- Double Top
- Triple Bottom
- Triple Bottom
- Triple Top
- Triple Top
- Все
- Все
- Покупка
- Продажа
- Все
- 1
- 2
- 3
- 4
- 5
Bullish Flag
was formed on 09.04 at 00:35:19 (UTC+0)
signal strength 1 of 5
The Bullish Flag pattern which signals continuation of a trend has been formed on the chart EURCAD M5. Forecast: if the price breaks above the pattern high at 1.5658, then
The M5 and M15 time frames may have more false entry points.
Open chart in a new window
Bullish pennant
was formed on 09.04 at 00:35:14 (UTC+0)
signal strength 1 of 5
The Bullish pennant graphic pattern has formed on the EURCAD M5 instrument. This pattern type falls under the category of continuation patterns. In this case, if the quote can breaks
The M5 and M15 time frames may have more false entry points.
Open chart in a new window
Double Bottom
was formed on 08.04 at 23:50:31 (UTC+0)
signal strength 1 of 5
The Double Bottom pattern has been formed on GBPJPY M5. This formation signals a reversal of the trend from downwards to upwards. The signal is that a buy trade should
The M5 and M15 time frames may have more false entry points.
Open chart in a new window