Прямоугольник
сформирован 26.03 в 14:44:03 (UTC+0)
сила сигнала 2 из 5

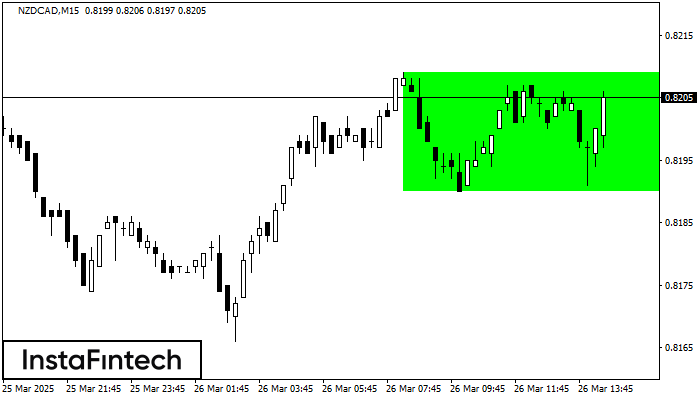
По торговому инструменту NZDCAD на M15 сформировалась фигура продолжения тренда - «Прямоугольник». Фигура имеет границы: Нижняя 0.8190; Верхняя 0.8209. В случае пробоя верхней границы вероятно дальнейшее движение в сторону тренда.
Таймфреймы М5 и М15 могут иметь больше ложных точек входа.
Сондай-ақ қараңыз
- Все
- Все
- Bearish Rectangle
- Bearish Symmetrical Triangle
- Bullish Rectangle
- Double Top
- Double Top
- Triple Bottom
- Triple Bottom
- Triple Top
- Triple Top
- Все
- Все
- Покупка
- Продажа
- Все
- 1
- 2
- 3
- 4
- 5
Bullish pennant
was formed on 23.04 at 19:01:49 (UTC+0)
signal strength 3 of 5
The Bullish pennant graphic pattern has formed on the #NTDOY M30 instrument. This pattern type falls under the category of continuation patterns. In this case, if the quote can breaks
Open chart in a new window
Bullish pennant
was formed on 23.04 at 19:01:45 (UTC+0)
signal strength 3 of 5
The Bullish pennant pattern is formed on the #NTDOY M30 chart. It is a type of the continuation pattern. Supposedly, in case the price is fixed above the pennant’s high
Open chart in a new window
Bearish Flag
was formed on 23.04 at 19:00:20 (UTC+0)
signal strength 2 of 5
The Bearish Flag pattern has been formed on the chart NZDUSD M15. Therefore, the downwards trend is likely to continue in the nearest term. As soon as the price breaks
The M5 and M15 time frames may have more false entry points.
Open chart in a new window