वास्तविक पैटर्न

पैटर्न ग्राफिकल मॉडल हैं जो चार्ट में मूल्य से बने होते हैं। तकनीकी विश्लेषण भविष्यवाणियों में से एक के अनुसार, इतिहास का मतलब मूल्य आंदोलन खुद को दोहराता है। इसका मतलब है कि मूल्य आंदोलन अक्सर एक ही परिस्थितियों में समान होते हैं जो उच्च संभावना के साथ स्थिति के आगे के विकास की भविष्यवाणी करना संभव बनाता है।
इंस्टा फॉरेक्स द्वारा प्रासंगिक पैटर्न एक उपयोग में आसान सेवा है जो आपको बाजार में नवीनतम परिवर्तनों के बारे में जागरूक होने और समय पर बाजार से संकेतों पर प्रतिक्रिया करने की अनुमति देती है। हमारी सेवा में आप हमेशा किसी भी जोड़ी और किसी भी समय सीमा पर नवीनतम और सबसे प्रासंगिक पैटर्न प्राप्त कर सकते हैं.
Double Bottom
was formed on 03.04 at 13:24:54 (UTC+0)
signal strength 1 of 5
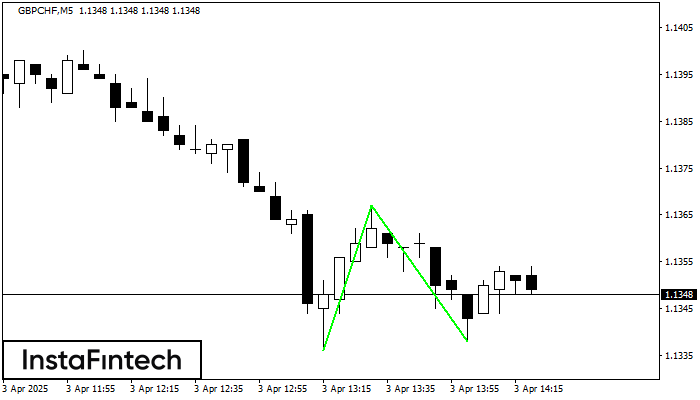
The Double Bottom pattern has been formed on GBPCHF M5. Characteristics: the support level 1.1336; the resistance level 1.1367; the width of the pattern 31 points. If the resistance level is broken, a change in the trend can be predicted with the first target point lying at the distance of 29 points.
The M5 and M15 time frames may have more false entry points.
- All
- All
- Bearish Rectangle
- Bearish Symmetrical Triangle
- Bearish Symmetrical Triangle
- Bullish Rectangle
- Double Top
- Double Top
- Triple Bottom
- Triple Bottom
- Triple Top
- Triple Top
- All
- All
- Buy
- Sale
- All
- 1
- 2
- 3
- 4
- 5
Bearish pennant
was formed on 21.04 at 21:30:29 (UTC+0)
signal strength 4 of 5

The Bearish pennant pattern has formed on the #FB H1 chart. This pattern type is characterized by a slight slowdown after which the price will move in the direction
Open chart in a new window
Triple Bottom
was formed on 21.04 at 21:30:21 (UTC+0)
signal strength 2 of 5

The Triple Bottom pattern has been formed on #AAPL M15. It has the following characteristics: resistance level 191.73/191.10; support level 189.80/190.18; the width is 193 points. In the event
The M5 and M15 time frames may have more false entry points.
Open chart in a new window
Double Top
was formed on 21.04 at 21:30:13 (UTC+0)
signal strength 2 of 5
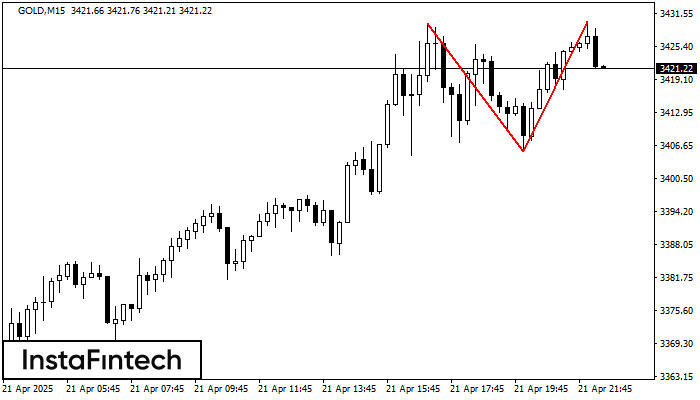
The Double Top reversal pattern has been formed on GOLD M15. Characteristics: the upper boundary 3429.80; the lower boundary 3405.54; the width of the pattern is 2449 points. Sell trades
The M5 and M15 time frames may have more false entry points.
Open chart in a new window