वास्तविक पैटर्न

पैटर्न ग्राफिकल मॉडल हैं जो चार्ट में मूल्य से बने होते हैं। तकनीकी विश्लेषण भविष्यवाणियों में से एक के अनुसार, इतिहास का मतलब मूल्य आंदोलन खुद को दोहराता है। इसका मतलब है कि मूल्य आंदोलन अक्सर एक ही परिस्थितियों में समान होते हैं जो उच्च संभावना के साथ स्थिति के आगे के विकास की भविष्यवाणी करना संभव बनाता है।
इंस्टा फॉरेक्स द्वारा प्रासंगिक पैटर्न एक उपयोग में आसान सेवा है जो आपको बाजार में नवीनतम परिवर्तनों के बारे में जागरूक होने और समय पर बाजार से संकेतों पर प्रतिक्रिया करने की अनुमति देती है। हमारी सेवा में आप हमेशा किसी भी जोड़ी और किसी भी समय सीमा पर नवीनतम और सबसे प्रासंगिक पैटर्न प्राप्त कर सकते हैं.
Triple Bottom
was formed on 31.03 at 23:06:34 (UTC+0)
signal strength 1 of 5
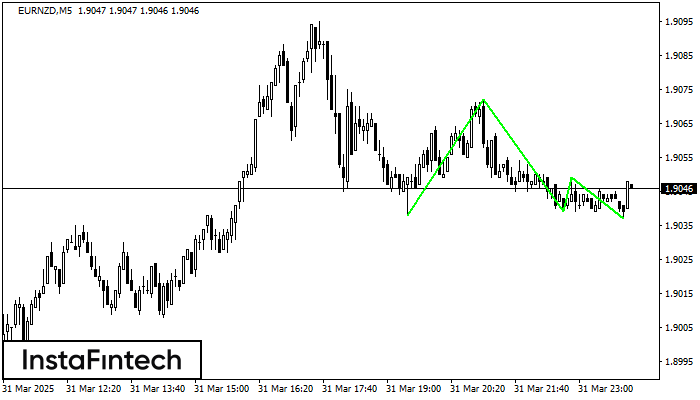
The Triple Bottom pattern has been formed on EURNZD M5. It has the following characteristics: resistance level 1.9072/1.9049; support level 1.9038/1.9037; the width is 34 points. In the event of a breakdown of the resistance level of 1.9072, the price is likely to continue an upward movement at least to 1.9054.
The M5 and M15 time frames may have more false entry points.
- All
- All
- Bearish Rectangle
- Bearish Symmetrical Triangle
- Bearish Symmetrical Triangle
- Bullish Rectangle
- Double Top
- Double Top
- Triple Bottom
- Triple Bottom
- Triple Top
- Triple Top
- All
- All
- Buy
- Sale
- All
- 1
- 2
- 3
- 4
- 5
Double Bottom
was formed on 22.04 at 15:30:30 (UTC+0)
signal strength 4 of 5
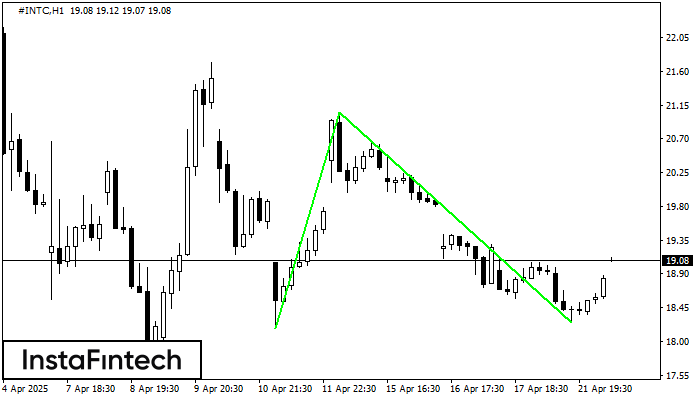
The Double Bottom pattern has been formed on #INTC H1; the upper boundary is 21.05; the lower boundary is 18.25. The width of the pattern is 287 points. In case
Open chart in a new window
Double Bottom
was formed on 22.04 at 14:06:13 (UTC+0)
signal strength 1 of 5

The Double Bottom pattern has been formed on NZDCHF M5; the upper boundary is 0.4874; the lower boundary is 0.4857. The width of the pattern is 17 points. In case
The M5 and M15 time frames may have more false entry points.
Open chart in a new window
Double Bottom
was formed on 22.04 at 13:40:19 (UTC+0)
signal strength 1 of 5

The Double Bottom pattern has been formed on GBPJPY M5. Characteristics: the support level 187.44; the resistance level 187.65; the width of the pattern 21 points. If the resistance level
The M5 and M15 time frames may have more false entry points.
Open chart in a new window