Pola sebenarnya

Bullish Symmetrical Triangle
was formed on 04.04 at 05:20:08 (UTC+0)
signal strength 1 of 5

According to the chart of M5, #Bitcoin formed the Bullish Symmetrical Triangle pattern. Description: This is the pattern of a trend continuation. 83376.14 and 82331.42 are the coordinates of the upper and lower borders respectively. The pattern width is measured on the chart at 104472 pips. Outlook: If the upper border 83376.14 is broken, the price is likely to continue its move by 82907.57.
The M5 and M15 time frames may have more false entry points.
Lihat juga
- All
- All
- Bearish Rectangle
- Bearish Symmetrical Triangle
- Bearish Symmetrical Triangle
- Bullish Rectangle
- Double Top
- Double Top
- Triple Bottom
- Triple Bottom
- Triple Top
- Triple Top
- All
- All
- Buy
- Sale
- All
- 1
- 2
- 3
- 4
- 5
Double Top
was formed on 24.04 at 05:15:14 (UTC+0)
signal strength 1 of 5
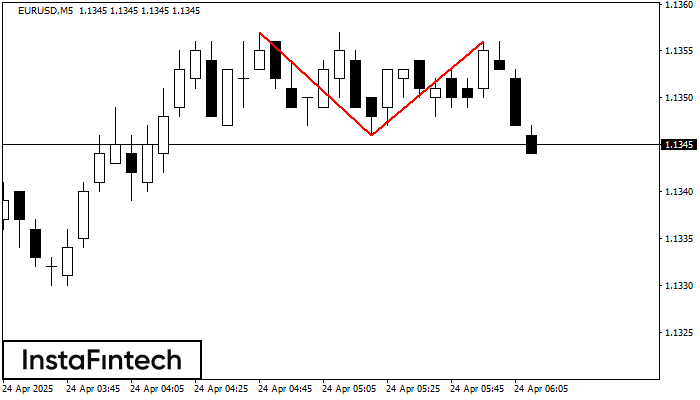
The Double Top reversal pattern has been formed on EURUSD M5. Characteristics: the upper boundary 1.1357; the lower boundary 1.1346; the width of the pattern is 10 points. Sell trades
The M5 and M15 time frames may have more false entry points.
Open chart in a new window
Double Bottom
was formed on 24.04 at 05:10:13 (UTC+0)
signal strength 1 of 5
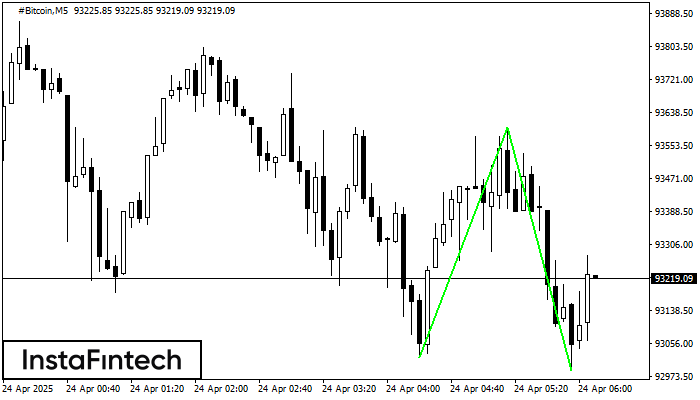
The Double Bottom pattern has been formed on #Bitcoin M5; the upper boundary is 93600.13; the lower boundary is 92988.03. The width of the pattern is 58107 points. In case
The M5 and M15 time frames may have more false entry points.
Open chart in a new window
Inverse Head and Shoulder
was formed on 24.04 at 05:00:22 (UTC+0)
signal strength 1 of 5

According to the chart of M5, AUDUSD produced the pattern termed the Inverse Head and Shoulder. The Head is fixed at 0.6353 while the median line of the Neck
The M5 and M15 time frames may have more false entry points.
Open chart in a new window