Pola sebenarnya

Bearish Flag
was formed on 04.04 at 03:26:08 (UTC+0)
signal strength 1 of 5

The Bearish Flag pattern has been formed on the chart AUDCAD M5 which signals that the downward trend will continue. If the price breaks below the low at 0.8881, then it is most likely to move further downwards. The price will likely move by the number of points which equals the length of the flag pole (10 points).
The M5 and M15 time frames may have more false entry points.
- All
- All
- Bearish Rectangle
- Bearish Symmetrical Triangle
- Bearish Symmetrical Triangle
- Bullish Rectangle
- Double Top
- Double Top
- Triple Bottom
- Triple Bottom
- Triple Top
- Triple Top
- All
- All
- Buy
- Sale
- All
- 1
- 2
- 3
- 4
- 5
Bullish Symmetrical Triangle
was formed on 17.04 at 09:11:38 (UTC+0)
signal strength 1 of 5
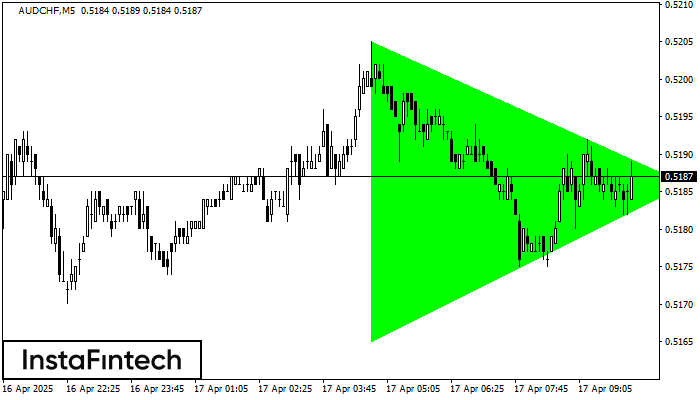
According to the chart of M5, AUDCHF formed the Bullish Symmetrical Triangle pattern. The lower border of the pattern touches the coordinates 0.5165/0.5186 whereas the upper border goes across 0.5205/0.5186
The M5 and M15 time frames may have more false entry points.
Open chart in a new window
Bullish pennant
was formed on 17.04 at 09:00:37 (UTC+0)
signal strength 1 of 5
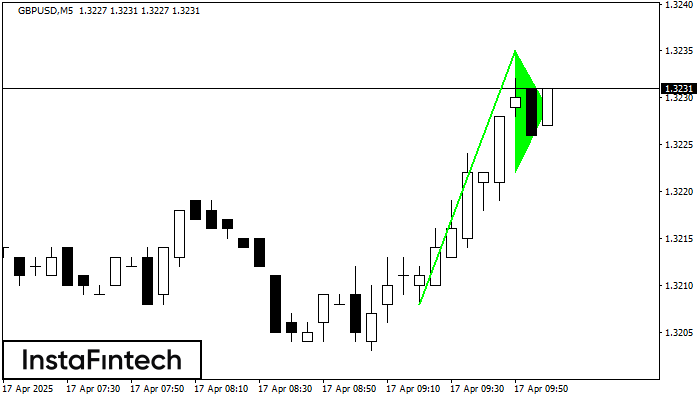
The Bullish pennant graphic pattern has formed on the GBPUSD M5 instrument. This pattern type falls under the category of continuation patterns. In this case, if the quote can breaks
The M5 and M15 time frames may have more false entry points.
Open chart in a new window
Double Bottom
was formed on 17.04 at 09:00:17 (UTC+0)
signal strength 3 of 5
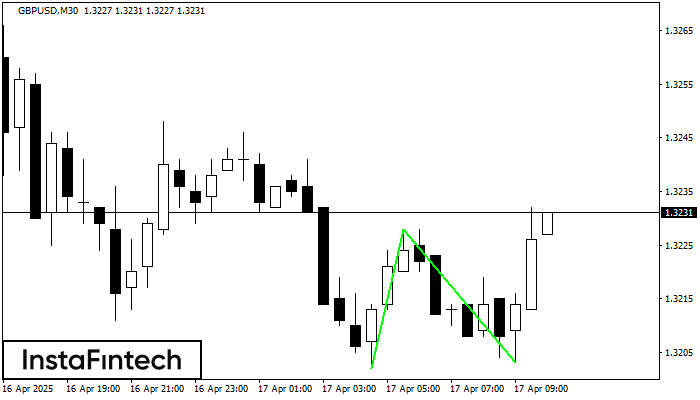
The Double Bottom pattern has been formed on GBPUSD M30; the upper boundary is 1.3228; the lower boundary is 1.3203. The width of the pattern is 26 points. In case
Open chart in a new window