Pola sebenarnya

Bearish Symmetrical Triangle
was formed on 04.04 at 02:03:44 (UTC+0)
signal strength 3 of 5
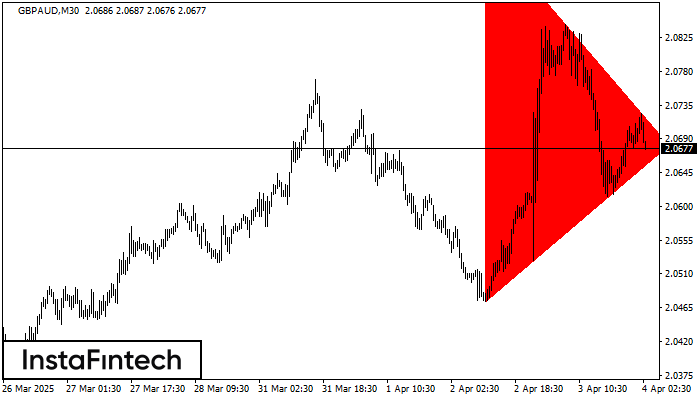
According to the chart of M30, GBPAUD formed the Bearish Symmetrical Triangle pattern. This pattern signals a further downward trend in case the lower border 2.0473 is breached. Here, a hypothetical profit will equal the width of the available pattern that is -495 pips.
- All
- All
- Bearish Rectangle
- Bearish Symmetrical Triangle
- Bearish Symmetrical Triangle
- Bullish Rectangle
- Double Top
- Double Top
- Triple Bottom
- Triple Bottom
- Triple Top
- Triple Top
- All
- All
- Buy
- Sale
- All
- 1
- 2
- 3
- 4
- 5
Double Bottom
was formed on 24.04 at 10:45:49 (UTC+0)
signal strength 2 of 5
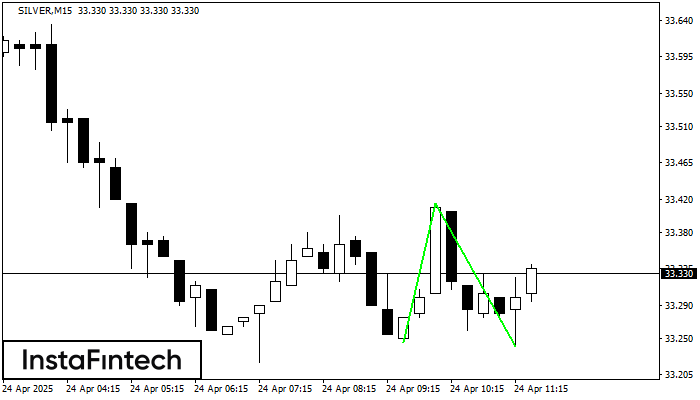
The Double Bottom pattern has been formed on SILVER M15. Characteristics: the support level 33.24; the resistance level 33.41; the width of the pattern 170 points. If the resistance level
The M5 and M15 time frames may have more false entry points.
Open chart in a new window
Bearish Symmetrical Triangle
was formed on 24.04 at 10:20:21 (UTC+0)
signal strength 1 of 5

According to the chart of M5, GOLD formed the Bearish Symmetrical Triangle pattern. Description: The lower border is 3314.14/3331.45 and upper border is 3343.45/3331.45. The pattern width is measured
The M5 and M15 time frames may have more false entry points.
Open chart in a new window
Triple Bottom
was formed on 24.04 at 10:00:17 (UTC+0)
signal strength 4 of 5

The Triple Bottom pattern has formed on the chart of EURUSD H1. Features of the pattern: The lower line of the pattern has coordinates 1.1439 with the upper limit 1.1439/1.1357
Open chart in a new window