Pola sebenarnya

Bullish Rectangle
was formed on 04.04 at 00:05:11 (UTC+0)
signal strength 1 of 5
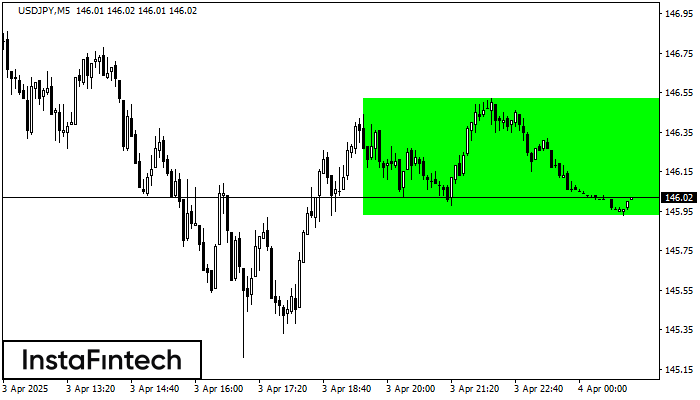
According to the chart of M5, USDJPY formed the Bullish Rectangle. This type of a pattern indicates a trend continuation. It consists of two levels: resistance 146.52 and support 145.93. In case the resistance level 146.52 - 146.52 is broken, the instrument is likely to follow the bullish trend.
The M5 and M15 time frames may have more false entry points.
Lihat juga
- All
- All
- Bearish Rectangle
- Bearish Symmetrical Triangle
- Bearish Symmetrical Triangle
- Bullish Rectangle
- Double Top
- Double Top
- Triple Bottom
- Triple Bottom
- Triple Top
- Triple Top
- All
- All
- Buy
- Sale
- All
- 1
- 2
- 3
- 4
- 5
Triple Bottom
was formed on 23.04 at 12:15:11 (UTC+0)
signal strength 2 of 5

The Triple Bottom pattern has formed on the chart of the USDJPY M15 trading instrument. The pattern signals a change in the trend from downwards to upwards in the case
The M5 and M15 time frames may have more false entry points.
Open chart in a new window
Double Bottom
was formed on 23.04 at 12:00:11 (UTC+0)
signal strength 2 of 5

The Double Bottom pattern has been formed on USDJPY M15; the upper boundary is 141.96; the lower boundary is 141.59. The width of the pattern is 41 points. In case
The M5 and M15 time frames may have more false entry points.
Open chart in a new window
Bullish Symmetrical Triangle
was formed on 23.04 at 11:41:41 (UTC+0)
signal strength 2 of 5

According to the chart of M15, NZDJPY formed the Bullish Symmetrical Triangle pattern. Description: This is the pattern of a trend continuation. 85.15 and 84.50 are the coordinates
The M5 and M15 time frames may have more false entry points.
Open chart in a new window