Pola sebenarnya

Bullish Symmetrical Triangle
was formed on 02.04 at 16:05:10 (UTC+0)
signal strength 1 of 5
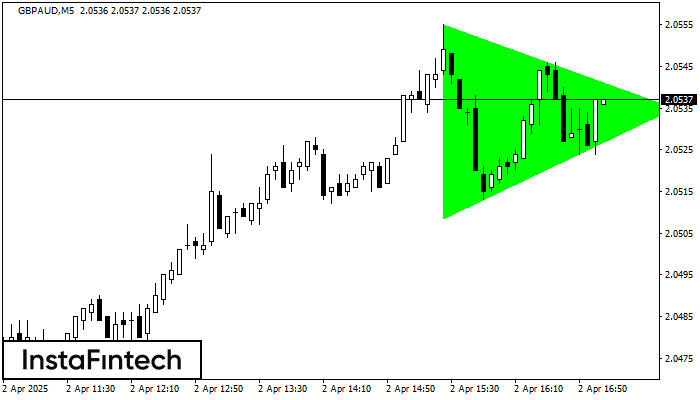
According to the chart of M5, GBPAUD formed the Bullish Symmetrical Triangle pattern. The lower border of the pattern touches the coordinates 2.0508/2.0535 whereas the upper border goes across 2.0555/2.0535. If the Bullish Symmetrical Triangle pattern is in progress, this evidently signals a further upward trend. In other words, in case the scenario comes true, the price of GBPAUD will breach the upper border to head for 2.0550.
The M5 and M15 time frames may have more false entry points.
- All
- All
- Bearish Rectangle
- Bearish Symmetrical Triangle
- Bearish Symmetrical Triangle
- Bullish Rectangle
- Double Top
- Double Top
- Triple Bottom
- Triple Bottom
- Triple Top
- Triple Top
- All
- All
- Buy
- Sale
- All
- 1
- 2
- 3
- 4
- 5
Bawah Triple
was formed on 24.04 at 07:15:40 (UTC+0)
signal strength 2 of 5
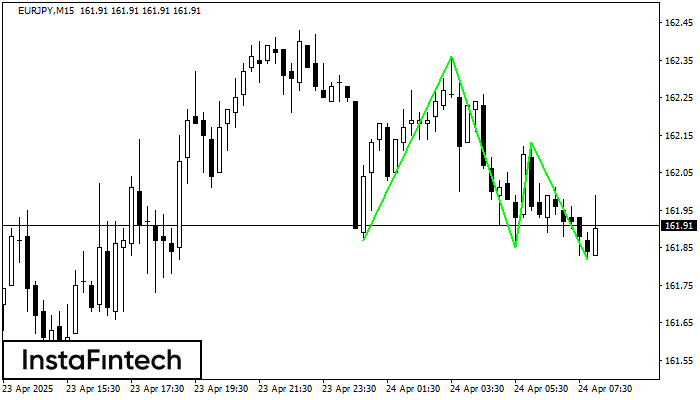
Pola Bawah Triple telah terbentuk pada grafik EURJPY M15. Fitur-fitur pola: garis bawah pola memiliki koordinat 162.36 dengan batas atas 162.36/162.13, proyeksi lebar adalah 49 poin. Pembentukan pola Bawah Triple
Rangka waktu M5 dan M15 mungkin memiliki lebih dari titik entri yang keliru.
Open chart in a new window
Teratas Ganda
was formed on 24.04 at 05:15:14 (UTC+0)
signal strength 1 of 5
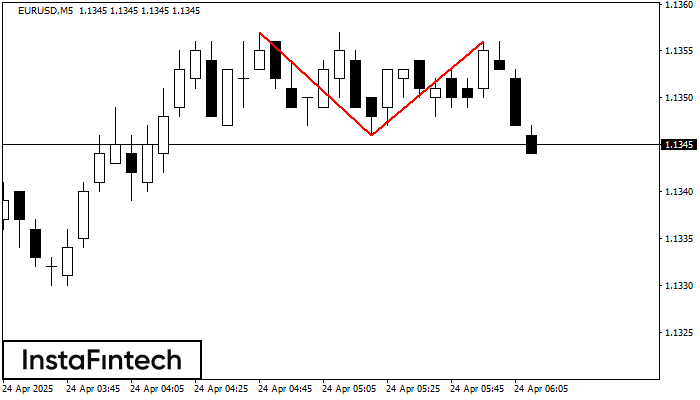
Pola reversal Teratas Ganda telah terbentuk pada EURUSD M5. Karakteristik: batas atas 1.1357; batas bawah 1.1346; lebar pola 10 poin. Transaksi jual lebih baik dibuka di bawah batas bawah 1.1346
Rangka waktu M5 dan M15 mungkin memiliki lebih dari titik entri yang keliru.
Open chart in a new window
Bawah Ganda
was formed on 24.04 at 05:10:13 (UTC+0)
signal strength 1 of 5
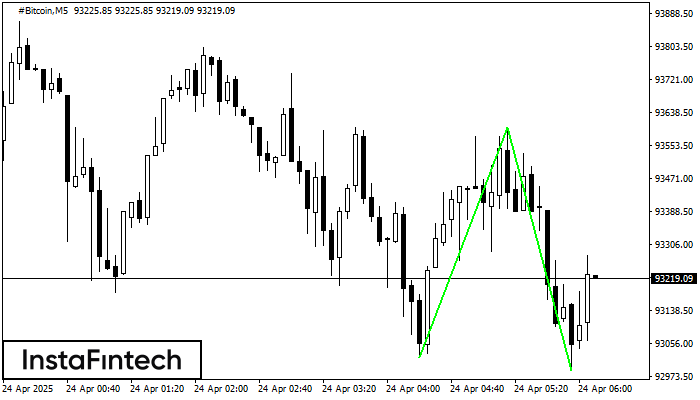
Pola Bawah Ganda telah terbentuk pada #Bitcoin M5; batas atas di 93600.13; batas bawah di 92988.03. Lebar pola sebesar 58107 poin. Jika harga menembus batas atas 93600.13, Perubahan dalam tren
Rangka waktu M5 dan M15 mungkin memiliki lebih dari titik entri yang keliru.
Open chart in a new window