Pola sebenarnya

Double Top
was formed on 01.04 at 17:39:37 (UTC+0)
signal strength 1 of 5
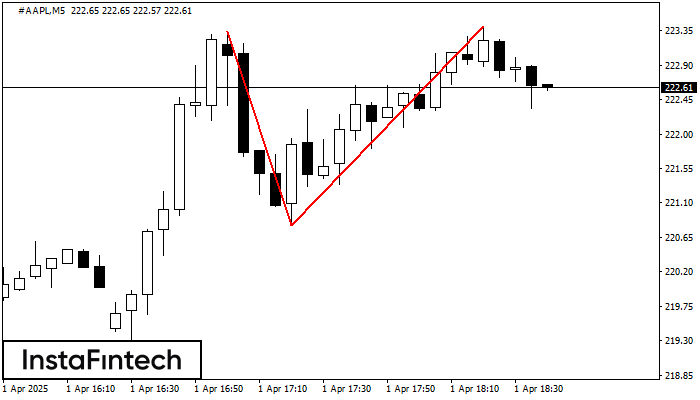
The Double Top reversal pattern has been formed on #AAPL M5. Characteristics: the upper boundary 223.34; the lower boundary 220.81; the width of the pattern is 259 points. Sell trades are better to be opened below the lower boundary 220.81 with a possible movements towards the 220.66 level.
The M5 and M15 time frames may have more false entry points.
- All
- All
- Bearish Rectangle
- Bearish Symmetrical Triangle
- Bearish Symmetrical Triangle
- Bullish Rectangle
- Double Top
- Double Top
- Triple Bottom
- Triple Bottom
- Triple Top
- Triple Top
- All
- All
- Buy
- Sale
- All
- 1
- 2
- 3
- 4
- 5
Double Top
was formed on 15.04 at 11:34:54 (UTC+0)
signal strength 1 of 5
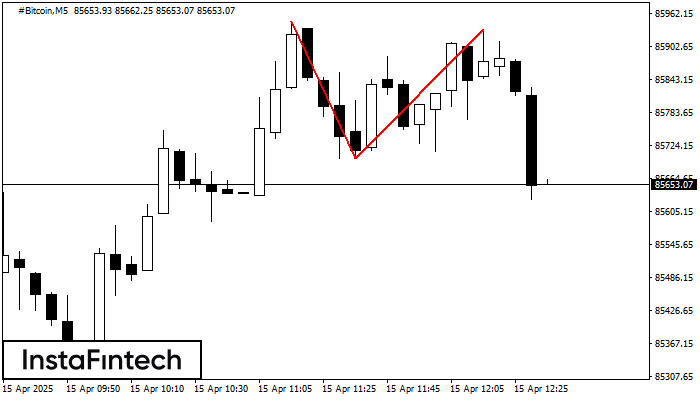
On the chart of #Bitcoin M5 the Double Top reversal pattern has been formed. Characteristics: the upper boundary 85934.04; the lower boundary 85700.13; the width of the pattern 23391 points
The M5 and M15 time frames may have more false entry points.
Open chart in a new window
Bearish Rectangle
was formed on 15.04 at 11:21:11 (UTC+0)
signal strength 2 of 5
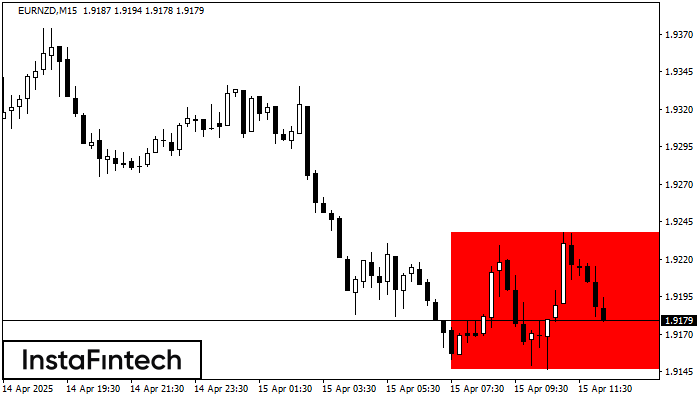
According to the chart of M15, EURNZD formed the Bearish Rectangle which is a pattern of a trend continuation. The pattern is contained within the following borders: lower border 1.9146
The M5 and M15 time frames may have more false entry points.
Open chart in a new window
Bullish Flag
was formed on 15.04 at 11:20:46 (UTC+0)
signal strength 1 of 5
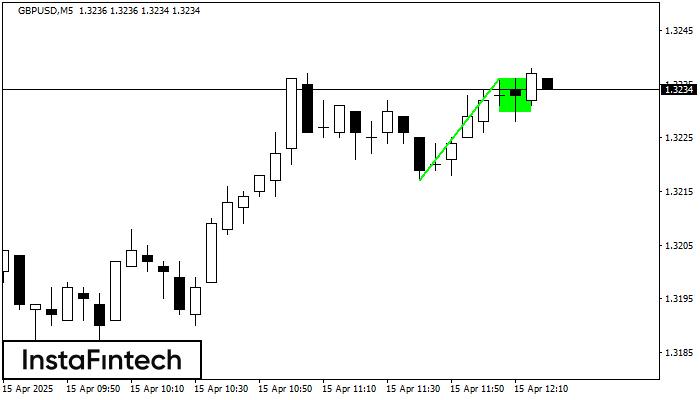
The Bullish Flag pattern which signals continuation of a trend has been formed on the chart GBPUSD M5. Forecast: if the price breaks above the pattern high at 1.3236, then
The M5 and M15 time frames may have more false entry points.
Open chart in a new window