Pola sebenarnya

Double Bottom
was formed on 31.03 at 15:30:26 (UTC+0)
signal strength 1 of 5
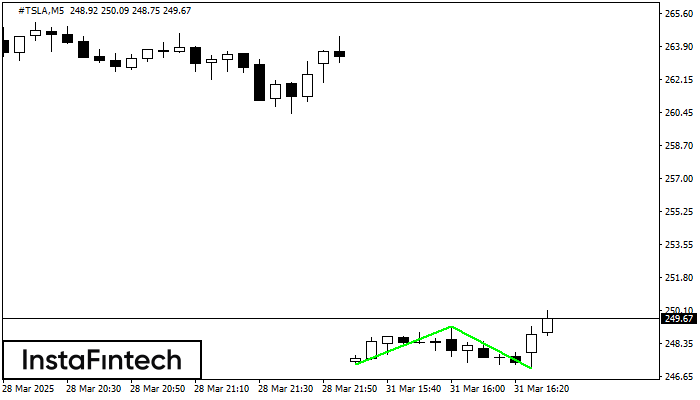
The Double Bottom pattern has been formed on #TSLA M5. This formation signals a reversal of the trend from downwards to upwards. The signal is that a buy trade should be opened after the upper boundary of the pattern 249.25 is broken. The further movements will rely on the width of the current pattern 198 points.
The M5 and M15 time frames may have more false entry points.
- All
- All
- Bearish Rectangle
- Bearish Symmetrical Triangle
- Bearish Symmetrical Triangle
- Bullish Rectangle
- Double Top
- Double Top
- Triple Bottom
- Triple Bottom
- Triple Top
- Triple Top
- All
- All
- Buy
- Sale
- All
- 1
- 2
- 3
- 4
- 5
Teratas Ganda
was formed on 17.04 at 06:00:30 (UTC+0)
signal strength 3 of 5

Pada grafik EURJPY M30 pola reversal Teratas Ganda telah terbentuk. Karakteristik: batas atas 162.23; batas bawah 161.48; lebar pola 75 poin. Sinyal: tembusan ke batas bawah akan menyebabkan kelanjutan tren
Open chart in a new window
Bawah Ganda
was formed on 17.04 at 05:55:25 (UTC+0)
signal strength 1 of 5

Pola Bawah Ganda telah terbentuk pada AUDUSD M5. Karakteristik: level support 0.6353; level resistance 0.6366; lebar pola 13 poin. Jika level resistance ditembus, perubahan dalam tren dapat diprediksi dengan target
Rangka waktu M5 dan M15 mungkin memiliki lebih dari titik entri yang keliru.
Open chart in a new window
Persegi Bearish
was formed on 17.04 at 05:27:54 (UTC+0)
signal strength 1 of 5

Menurut grafik dari M5, AUDUSD terbentuk Persegi Bearish yang merupakan pola dari kelanjutan tren. Pola terkandung di dalam batas berikut: batas lebih rendah 0.6353 – 0.6353 dan batas atas 0.6366
Rangka waktu M5 dan M15 mungkin memiliki lebih dari titik entri yang keliru.
Open chart in a new window