Lihat juga


 16.03.2023 03:50 PM
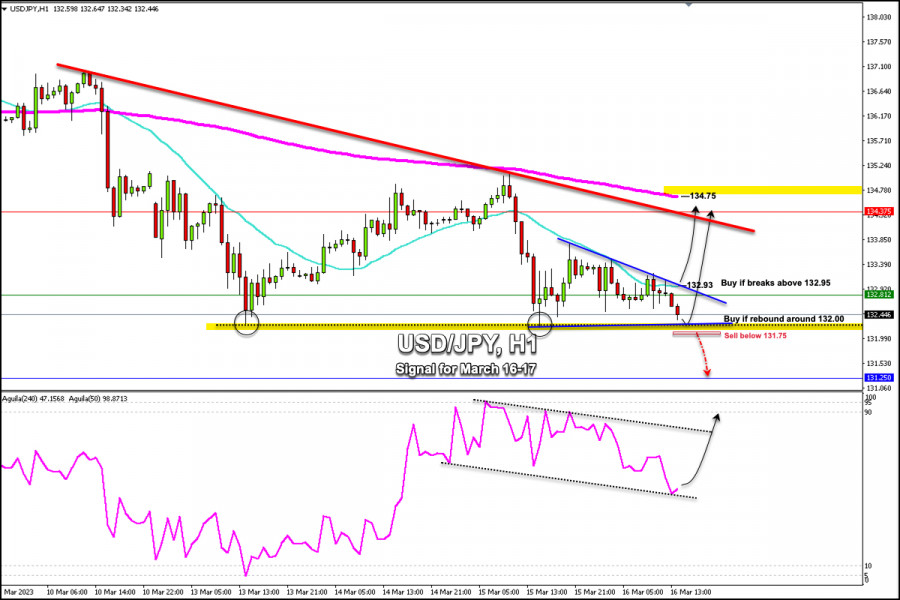
The 1-hour chart shows that USD/JPY has found strong support that is located around 132.00 – 131.80.
Currently, the instrument is trading below the 5/8 Murray (132.81) and below 21 SMA (132.93). If it fails to consolidate above 132.00, we could expect a continuation of the downtrend and the price could reach 131.50 and down to 4/8 Murray 131.25.
On the other hand, in case USD/JPY trades above 132.93 and if it surpasses the 21 SMA, we could expect a continuation of the upward movement and the instrument could reach 6/8 Murray at 134.37
The outlook is bearish as the pair is showing oversold signs, although the overall picture offers mixed signals. If the bullish move extends above 134.72 (200 EMA), the currency pair could gain further momentum and could reach 137.50 (8/8 Murray). Conversely, a drop below 131.75 could push the price to the weekly low of 131.25.
If the USD/JPY pair consolidates above 132.00 in the next few hours, it could continue with an upward move and could reach 134.37 (6/8 Murray). The eagle indicator is in the oversold zone. So, while the pair is trading above 132.00, any correction will be seen as an opportunity to buy.
You have already liked this post today
*Analisis pasar yang diposting disini dimaksudkan untuk meningkatkan pengetahuan Anda namun tidak untuk memberi instruksi trading.
Dengan munculnya Divergence antara pergerakan harga pasangan mata uang silang EUR/JPY dengan indikator Stochastic Oscillator juga diikuti oleh hadirnya pola Bullish 123 yang diikuti oleh Bullish Ross Hook (RH)
Pada chart 4 jamnya, pasangan mata uang silang GBP/AUD nampak terlihat bergerak dibawah EMA (21)-nya dan indikator Stochastic Oscillator dalam kondisi Crossing SELL, maka dalam waktu dekat berdasarkan kedua info
Rencana trading kami untuk beberapa jam ke depan adalah menjual emas di bawah 3.224, dengan target di 3.203 dan 3.156. Kita harus waspada terhadap setiap rebound teknis, karena prospek tetap
Pada chart 4 jamnya instrument komoditi Minyak Mentah nampak terlihat munculnya pola Inverted Head & Shoulders serta Bullish Pola 123 dan Divergence antara pergerakan harga #CL dengan indikator Stochastic Oscillator
Dengan munculnya Divergence dari indikator Stochastic Oscillator dengan pergerakan harga XPD/USD di chart 4 jamnya serta munculnya pola Bullish 123 yang diikuti oleh pergerakan harganya yang bergerak diatas EMA (21)
Selama sesi Eropa, euro mencapai level tertinggi baru sekitar +2/8 Murray, yang terletak di 1.1473. Pergerakan EUR/USD ini terjadi setelah pengumuman oleh Kementerian Keuangan Tiongkok bahwa Beijing akan menaikkan tarif
Pada awal sesi Amerika, emas mengalami koreksi teknikal yang kuat setelah mencapai level tertinggi baru sekitar 3.237,69 untuk saat ini. Data ekonomi dari Amerika Serikat akan dirilis dalam beberapa
Klub InstaTrade

Your IP address shows that you are currently located in the USA. If you are a resident of the United States, you are prohibited from using the services of InstaFintech Group including online trading, online transfers, deposit/withdrawal of funds, etc.
If you think you are seeing this message by mistake and your location is not the US, kindly proceed to the website. Otherwise, you must leave the website in order to comply with government restrictions.
Why does your IP address show your location as the USA?
Please confirm whether you are a US resident or not by clicking the relevant button below. If you choose the wrong option, being a US resident, you will not be able to open an account with InstaTrade anyway.
We are sorry for any inconvenience caused by this message.

