empty
26.09.2019 01:45 PM
Technical analysis of AUD/USD for September 26, 2019

This image is no longer relevant

Overview:

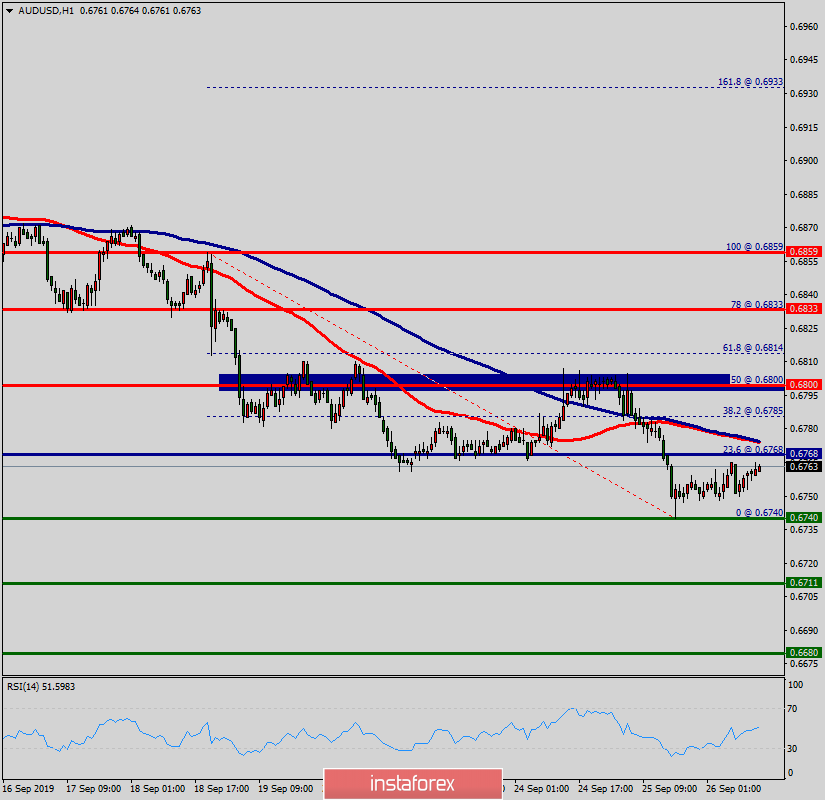
The AUD/USD pair hit the weekly pivot point and resistance 1, because of the series of relatively equal highs and equal lows. But, the pair has dropped down from the price of 0.6800 in order to bottom at the point of 0.6740. Hence, the major support was already set at the level of 0.6740. Moreover, the double bottom is also coinciding with the major support this week. Equally important, the RSI and the moving average (100) are still calling for a downtrend. Therefore, the market indicates a bearish opportunity at the level of 0.6800. Today, in the one-hour chart, the current rise will remain within a framework of correction. From this point, sell orders are recommended below the spot of 0.6800 with the first target at the level of 0.6740. If the pair succeeds to pass through the level of 0.6740, the market will indicate a bearish opportunity below the level of 0.6711.

Trading recommendations:

According to the previous events of AUD/USD pair in the Forex market, the price has still been trading between the level of 0.6800 and the 0.6740 level. Therefore, it will be advantageous to sell below 0.6800 with a first target 0.6740 in order to test the double point. It may resume to 0.6711 if the price is able to break 0.6740. On the other hand, stop loss should always be in account, consequently, it will be of wholesome to set the stop loss above the resistance 1 at the price of 0.6833. Today, in the one-hour chart, the current rise will remain within a framework of correction.

Recommended Stories

Sinyal Trading untuk EUR/USD pada 24-26 April 2025: jual di bawah 1,1435 (21 SMA - 7/8 Murray)

Pada sesi Amerika awal, pasangan EUR/USD diperdagangkan di sekitar 1,1358 dalam saluran tren turun yang terbentuk pada 18 April. Pasangan ini berada di bawah tekanan bearish. Kami percaya instrumen

Dimitrios Zappas 17:06 2025-04-24 UTC+2

EMAS. Harga Emas Mungkin Akan Turun Secara Signifikan dalam Waktu Dekat

Harga emas belakangan ini mengalami koreksi yang signifikan di tengah ekspektasi pasar akan dimulainya negosiasi nyata antara AS dan Tiongkok mengenai tarif dan perdagangan secara keseluruhan. Pernyataan Menteri Keuangan

Pati Gani 09:38 2025-04-24 UTC+2

Analisis Teknikal Pergerakan Harga Indeks Nasdaq 100 , Kamis 24 April 2025.

Meski di chart 4 jamnya indeks Nasdaq 100 tengah Sideways, namun kisarannya cukup besar sehingga masih ada peluang yang cukup menjanjikan di indeks tersebut. Saat ini indikator Stochastic Oscillator tengah

Arief Makmur 05:38 2025-04-24 UTC+2

Analisis Teknikal Pergerakan Harga Instrumen Komoditi Perak , Kamis 24 April 2025.

Pada chart 4 jamnya, instrument komoditi Perak nampak terlihat meski kondisinya tengah menguat di mana hal ini terkonfirmasi oleh pergerakan harga Perak yang bergerak diatas WMA (30 Shift 2) yang

Arief Makmur 05:32 2025-04-24 UTC+2

Sinyal Trading untuk EMAS (XAU/USD) pada 23-25 April 2025: jual di bawah $3.333 (200 EMA - 6/8 Murray)

Rencana trading kami untuk beberapa jam ke depan adalah menjual emas di bawah $3.333, dengan target di $3.313 dan $3.291. Kami dapat membeli di atas $3.280 dengan target jangka pendek

Dimitrios Zappas 14:31 2025-04-23 UTC+2

Analisa Teknikal Pergerakan Harga Intraday Pasangan Mata Uang Silang AUD/JPY, Rabu 23 April 2025.

Dengan munculnya Divergence antara pergerakan harga pasangan mata uang silang AUD/JPY dengan indikator Stochastic Oscillator serta pergerakan harga AUD/JPY yang berada diatas WMA (30 Shift 2) yang juga memiliki kemiringan

Arief Makmur 06:04 2025-04-23 UTC+2

Analisa Teknikal Pergerakan Harga Intraday Instrumen Komoditi Emas, Rabu 23 April 2025.

Bila Kita perhatikan pada chart 4 jamnya, instrumen komoditi Emas nampak terlihat masih bergerak dalam bias yang Bullish, namun dengan kemunculan Divergence antara pergerakan harga Emas dengan indikator Stochastic Oscillator

Arief Makmur 05:54 2025-04-23 UTC+2

Analisis Teknikal Pergerakan Harga Intraday Pasangan Mata Uang Silang AUD/CAD, Selasa 22 April 2025.

Dengan pergerakan harga pasangan mata uang silang AUD/CAD yang bergerak diatas WMA (21) yang memiliki kemiringan yang menukik keatas serta munculnya Convergence antara pergerakan harga AUD/CAD dengan indikator Stochastic Oscillator

Arief Makmur 04:33 2025-04-22 UTC+2

Analisis Teknikal Pergerakan Harga Intraday Pasangan Mata Uang Silang GBP/CHF, Selasa 22 April 2025.

Bila Kita perhatikan chart 4 jam dari pasangan mata uang silang GBP/CHF, maka nampak ada beberapa fakta-fakta yang menari. Pertama, munculnya pola Triangle yang diikuti oleh pergerakan EMA (21)-nya yang

Arief Makmur 04:26 2025-04-22 UTC+2

Sinyal Trading untuk EMAS (XAU/USD) pada 21-25 April 2025: jual di bawah $3.422 overbought - 8/8 Murray)

Indikator eagle telah mencapai level overbought. Namun, logam ini masih bisa mencapai level tinggi di sekitar 8/8 Murray, yang merupakan penghalang kuat bagi emas. Di bawah area ini, kita bisa

Dimitrios Zappas 17:23 2025-04-21 UTC+2
Tidak bisa bicara sekarang?
Tanyakan pertanyaan anda lewat chat.
 

Dear visitor,

Your IP address shows that you are currently located in the USA. If you are a resident of the United States, you are prohibited from using the services of InstaFintech Group including online trading, online transfers, deposit/withdrawal of funds, etc.

If you think you are seeing this message by mistake and your location is not the US, kindly proceed to the website. Otherwise, you must leave the website in order to comply with government restrictions.

Why does your IP address show your location as the USA?

  • - you are using a VPN provided by a hosting company based in the United States;
  • - your IP does not have proper WHOIS records;
  • - an error occurred in the WHOIS geolocation database.

Please confirm whether you are a US resident or not by clicking the relevant button below. If you choose the wrong option, being a US resident, you will not be able to open an account with InstaTrade anyway.

We are sorry for any inconvenience caused by this message.