Actual patterns

Patterns are graphical models which are formed in the chart by the price. According to one of the technical analysis postulates, history (price movement) repeats itself. It means that the price movements are often similar in the same situations which makes it possible to predict the further development of the situation with a high probability.
Relevant patterns by InstaTrade is an easy-to-use service which allows you to be aware of latest changes in the market and react to clues from the market in time. In our service you will always find the latest and most relevant patterns on any pair and any timeframe.
Actual Patterns
- All
- All
- Bearish Rectangle
- Bearish Symmetrical Triangle
- Bearish Symmetrical Triangle
- Bullish Rectangle
- Double Top
- Double Top
- Triple Bottom
- Triple Bottom
- Triple Top
- Triple Top
- All
- All
- Buy
- Sale
- All
- 1
- 2
- 3
- 4
- 5
Segi Tiga Simetri Menurun
was formed on 23.04 at 10:19:08 (UTC+0)
signal strength 1 of 5

Berdasarkan carta M5, AUDJPY membentuk corak Segi Tiga Simetri Menurun. Cadangan dagangan: Penembusan sempadan bawah 90.60 mungkin mendorong kepada kesinambungan aliran menurun
Carta masa M5 dan M15 mungkin mempunyai lebih banyak titik kemasukan palsu.
Open chart in a new window
Segi Tiga Simetri Menaik
was formed on 23.04 at 07:41:10 (UTC+0)
signal strength 1 of 5

Berdasarkan carta M5, NZDJPY membentuk corak Segi Tiga Simetri Menaik yang menandakan aliran akan berterusan. Penerangan. Sempadan atas corak menyentuh koordinat 85.07/84.81 sedangkan sempadan bawah merentasi 84.47/84.81. Lebar corak diukur
Carta masa M5 dan M15 mungkin mempunyai lebih banyak titik kemasukan palsu.
Open chart in a new window
Double Top
was formed on 23.04 at 07:15:07 (UTC+0)
signal strength 2 of 5
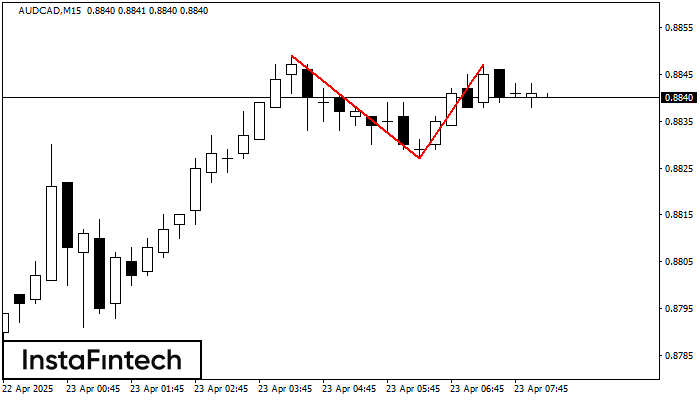
Corak Double Top telah dibentuk pada AUDCAD M15. Isyarat bahawa aliran telah berubah dari aliran menaik ke aliran menurun. Mungkin, sekiranya asas corak 0.8827 ditembusi, pergerakan menurun akan berterusan
Carta masa M5 dan M15 mungkin mempunyai lebih banyak titik kemasukan palsu.
Open chart in a new window