Voir aussi


 24.03.2023 10:21 AM
At a monetary policy meeting yesterday, the Bank of England raised interest rates by 25 basis points to 4.25%, the highest rates since October 2008. Back then, interest rates were at 4.50%. The increase came due to persistent inflation. In February and January, consumer prices accelerated to 10.4% and 10.1% respectively. Meanwhile, economists had expected inflation to slow down in February. However, the latest press release hints at a possible end of the tightening cycle in the near term. So, it may be that we will soon see the regulator pause tightening.
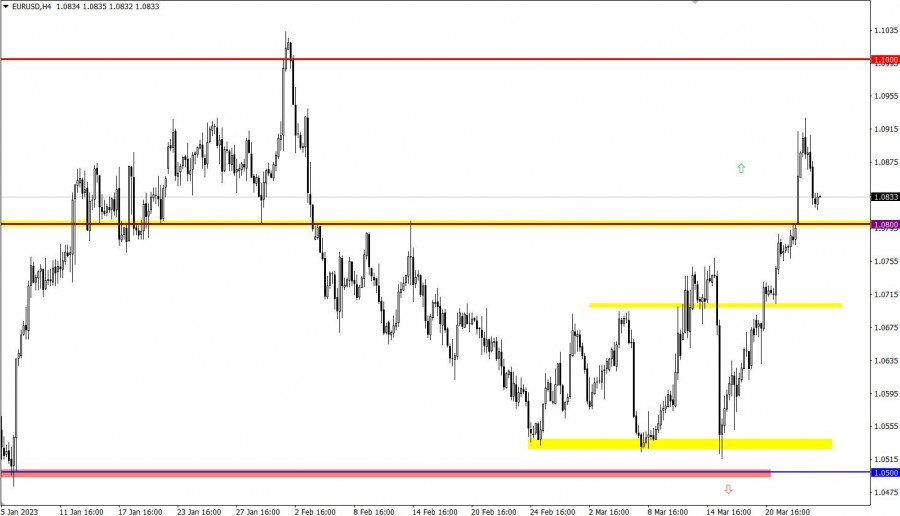
EUR/USD has gained over 250 pips since the beginning of the week. That triggered a horizontal movement with a signal to buy EUR. The volume of long positions decreased and the price retreated.
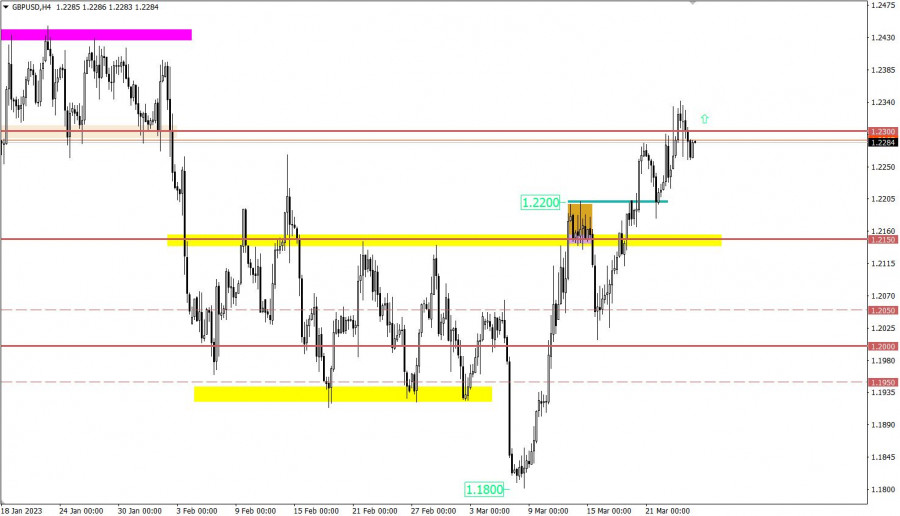
Once 1.2300 resistance was reached, GBP/USD pulled back somewhat. Nevertheless, the bull trend goes on. The pound has recouped almost all losses incurred in February.
With the opening of European trade, UK retail sales came in, showing a rise to -3.5% versus -5.4% year-on-year. On a monthly basis, figures grew by 1.2%.
Today, a series of business activity reports will be delivered in the eurozone, the United States, and the United Kingdom. Economists expect figures to decline across the board.
EUR/USD retreated to 1.0800 support. The price may rebound from this mark with a rise in buying volumes.
Alternatively, EUR/USD may go down if quotes stay below 1.0800 intraday.
A pullback may cause a shift in sentiment. Should the price go above 1.2300, it would generate a signal to buy GBP. This could lead to a bullish continuation, and the pair could update the swing high of the medium-term trend.
Alternatively, if quotes fall below 1.2200, it will mark the rise of a downtrend.
The candlestick chart shows graphical white and black rectangles with upward and downward lines. While conducting a detailed analysis of each individual candlestick, it is possible to notice its features intrinsic to a particular time frame: the opening price, the closing price, and the highest and lowest price.
Horizontal levels are price levels, in relation to which a stop or reversal of the price may occur. They are called support and resistance levels.
Circles and rectangles are highlighted examples where the price reversed in the course of its history. This color highlighting indicates horizontal lines which can exert pressure on prices in the future.
Upward/downward arrows signal a possible future price direction.
You have already liked this post today
*The market analysis posted here is meant to increase your awareness, but not to give instructions to make a trade.
Mardi, la paire de devises GBP/USD n'a pas réussi à poursuivre le mouvement haussier qu'elle avait démarré si vigoureusement lundi. Il convient de rappeler qu'il n'y avait pas de raisons
La paire de devises EUR/USD a continué de se négocier dans un canal latéral tout au long de la journée de mardi. Le mouvement stable est visible sur le graphique
Dans mes prévisions du matin, j'ai mis en avant le niveau de 1.3421 et prévu de prendre des décisions de trading basées sur celui-ci. Jetons un coup d'œil au graphique
Dans ma prévision matinale, j'ai attiré l'attention sur le niveau de 1.1378 et j'ai prévu de prendre des décisions de trading en fonction de celui-ci. Examinons le graphique
Lundi, la paire GBP/USD a augmenté de 130 pips. C'était donc ce « lundi ennuyeux » sans rapport macroéconomique ni discours important. La livre sterling a gagné plus d'un centime
Le lundi, la paire de devises EUR/USD a montré des mouvements quelque peu mitigés, peu importe comment vous la regardez. D'une part, la paire a démontré une forte hausse malgré
Ce lundi, la paire de devises GBP/USD a de nouveau progressé malgré l'absence de raisons fondamentales. Cependant, d'ici là, tous les traders devraient être habitués à de telles évolutions. Alors
Ce lundi, le couple de devises EUR/USD a montré un mouvement à la hausse relativement appréciable au cours de la journée, mais est resté à l'intérieur du canal étroit entre
Dans ma prévision matinale, je me suis concentré sur le niveau de 1.3342 et j'avais prévu de prendre des décisions de trading en fonction de celui-ci. Regardons le graphique
Dans ma prévision du matin, je me suis concentré sur le niveau de 1.1391 et j'ai prévu de prendre des décisions de trading à partir de là. Regardons le graphique
Vidéo de formation

Your IP address shows that you are currently located in the USA. If you are a resident of the United States, you are prohibited from using the services of InstaFintech Group including online trading, online transfers, deposit/withdrawal of funds, etc.
If you think you are seeing this message by mistake and your location is not the US, kindly proceed to the website. Otherwise, you must leave the website in order to comply with government restrictions.
Why does your IP address show your location as the USA?
Please confirm whether you are a US resident or not by clicking the relevant button below. If you choose the wrong option, being a US resident, you will not be able to open an account with InstaTrade anyway.
We are sorry for any inconvenience caused by this message.


