Voir aussi
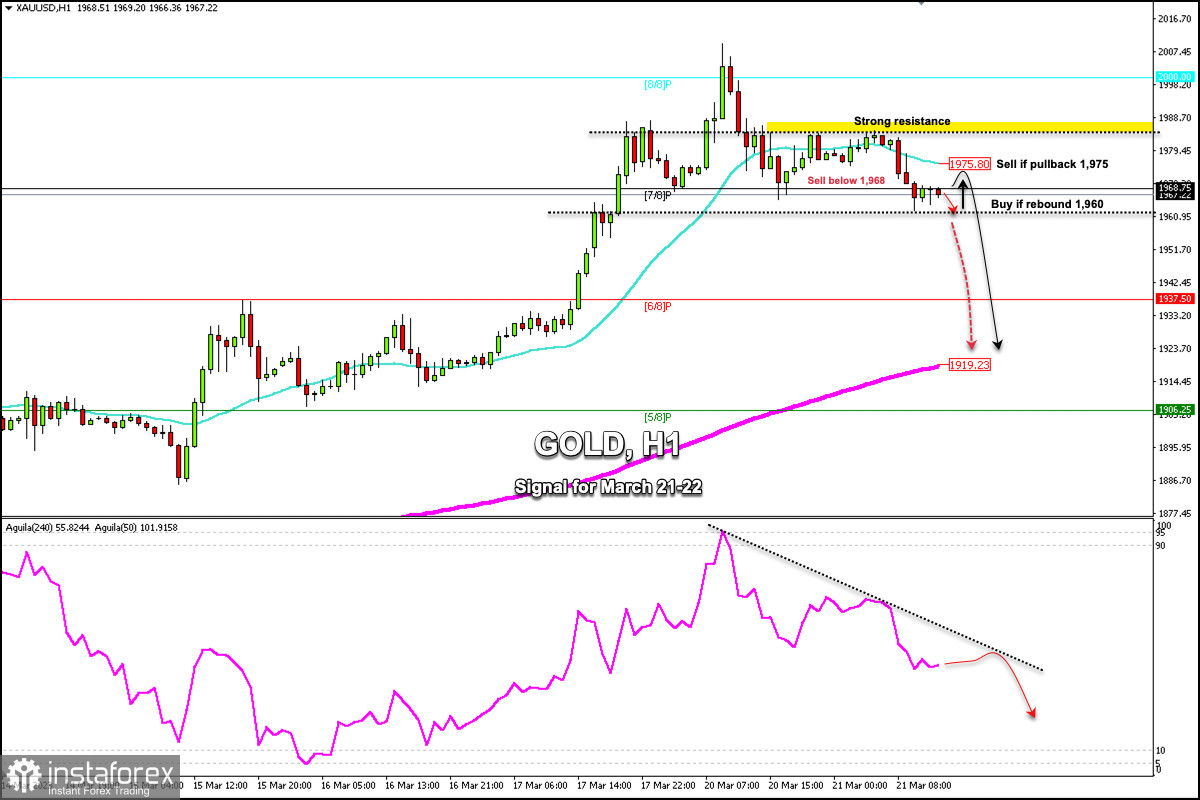
XAU/USD retreats from its annual high reached on March 20 at 2,009.66. The global banking jitters have passed for now and US Treasury yields have been bouncing, erasing Gold's strength.
According to the 1-hour chart, gold is trading below the 21 SMA located at 1,975 and below the strong resistance of 1,986. We can clearly see that the asset is under strong bearish pressure but it could find a bottom around 1,960. At this level in the 4-hour chart, we can see the 21 SMA which will act as strong support and gold could then resume the bullish cycle.
In case gold breaks out sharply and consolidates below 1,960, we would expect a bearish acceleration and the instrument could reach the 6/8 Murray at 1,937 and could ultimately reach the 200 EMA located at 1,919.
On the contrary, if gold remains above 1,960, it could give us a signal to buy with targets at 1,975 (21 SMA) and 1,986 (weekly_resistance).
Since its high reached in the last hours, gold has made a correction of almost $40 as part of profit taking. The instrument is likely to see a technical rebound in the coming hours and then continue with a short-term downtrend.
Our trading plan for the next few hours is to sell below 7/8 Murray located at 1,968, with targets at 1,960. Around this level, we can expect a technical bounce to buy with targets at 1,975. The Eagle indicator from 20 March is giving a negative signal. Hence, as long as the metal trades below 1,985, any technical bounce will be seen as a signal to sell.
You have already liked this post today
*The market analysis posted here is meant to increase your awareness, but not to give instructions to make a trade.
Liens utiles : Mes autres articles sont disponibles dans cette section Cours InstaForex pour débutants Analytics Populaires Ouvrir un compte de trading Important : Les débutants en trading forex doivent
Tôt dans la session américaine, la paire EUR/USD se négocie autour de 1,1358 au sein du canal baissier formé le 18 avril. La paire est sous pression baissière. Nous pensons
Liens utiles : Mes autres articles sont disponibles dans cette section Cours InstaForex pour débutants Analytique Populaire Ouvrir un compte de trading Important : Les débutants dans le trading forex
Sur le graphique de 4 heures, l'instrument de la matière première argent est visible même si sa condition se renforce, ce qui est confirmé par le mouvement du prix
Bien que sur le graphique de 4 heures, l'indice Nasdaq 100 soit en phase latérale, la fourchette est assez large pour offrir une opportunité assez prometteuse. Actuellement, l'indicateur Stochastic Oscillator
Avec l'apparition d'une divergence entre le mouvement des prix de la paire de devises croisées AUD/JPY et l'indicateur Stochastic Oscillator, ainsi que le mouvement des prix de l'AUD/JPY
Si nous examinons le graphique de 4 heures, l'instrument de la commodité Or semble toujours évoluer dans un biais haussier, mais l'apparition d'une divergence entre le mouvement du prix
Liens utiles : Mes autres articles sont disponibles dans cette section Cours InstaForex pour débutants Analyses Populaires Ouvrir un compte de trading Important : Les débutants en trading forex doivent
Notifications
SMS/E-mail
Your IP address shows that you are currently located in the USA. If you are a resident of the United States, you are prohibited from using the services of InstaFintech Group including online trading, online transfers, deposit/withdrawal of funds, etc.
If you think you are seeing this message by mistake and your location is not the US, kindly proceed to the website. Otherwise, you must leave the website in order to comply with government restrictions.
Why does your IP address show your location as the USA?
Please confirm whether you are a US resident or not by clicking the relevant button below. If you choose the wrong option, being a US resident, you will not be able to open an account with InstaTrade anyway.
We are sorry for any inconvenience caused by this message.