See also


 26.02.2025 06:49 AM
What we have been anticipating for weeks has now materialized. While many factors could have triggered Bitcoin's latest crash, analyzing them in detail won't make the situation any easier. The essence of market analysis is in forecasting and outlining possible scenarios. We have repeatedly warned that Bitcoin cannot rise indefinitely, and it now seems increasingly likely that we are entering a new downtrend. As is often the case, this decline began under seemingly stable market conditions, catching many traders off guard.
On Sunday, reports surfaced of a $1.5 billion hack at ByBit exchange. While it's unlikely that this event alone triggered Bitcoin's $13,000 drop over the past few days, it may have acted as a catalyst for the long-anticipated sell-off. Now that the decline has begun and is evident to everyone, many so-called "experts" are speculating that Bitcoin could fall to $70,000, while still maintaining its bullish trend. However, as we have always maintained, Bitcoin has the potential to drop even to zero. Investors who profited during the last bull cycle now have no reason to hold onto Bitcoin. Selling for profit and waiting for the next bullish cycle remains the most logical strategy.
Bitcoin remains unregulated, meaning it can fall to any level. Some analysts believe that once there is clarity on U.S. Bitcoin reserves, the first cryptocurrency will resume its growth. However, we are highly skeptical of this scenario.
BTC/USD Daily Chart Analysis
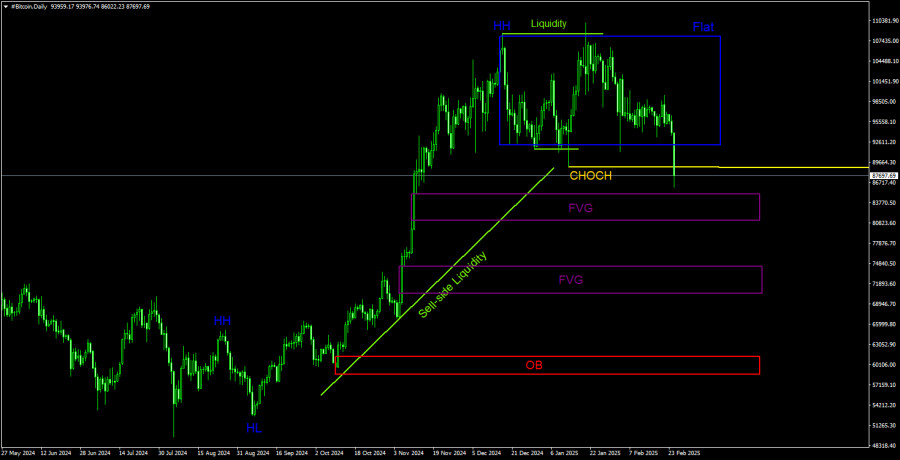
On the daily timeframe, Bitcoin now has a high probability of breaking below its range. After trading in a consolidation zone for an extended period, it is now experiencing a breakout to the downside. The CHOCH (Change of Character) line has been breached, which is the primary indicator of a trend reversal.
This suggests that a downtrend is beginning. The first downward targets are two Fair Value Gaps (FVGs). However, Bitcoin may continue falling toward the nearest Order Block (OB). If the structure officially shifts to bearish, the ideal trading strategy would be to wait for a correction before entering new short positions. This aligns with ICT system principles, which advocate selling after a corrective pullback rather than chasing price declines.
BTC/USD 4-Hour Chart Analysis
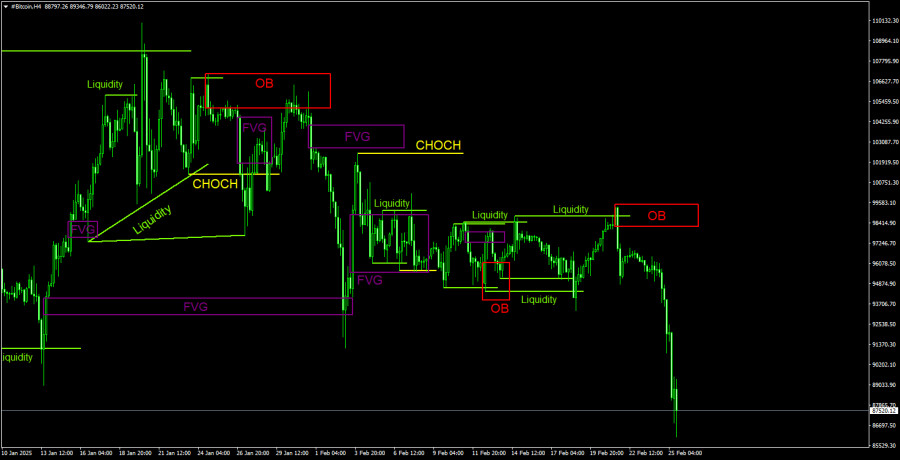
On the 4-hour timeframe, Bitcoin is experiencing a sharp sell-off. The price did not even attempt to return to the previous bearish Order Block, suggesting strong selling pressure.
One of the key warning signs before this decline was a triple liquidity sweep on the sell side. This means large players accumulated short positions by triggering Stop Loss orders placed above recent highs—a classic market-maker move.
Liquidity sweeps serve as reliable warning signals for upcoming trend reversals. While patterns like Order Blocks (OBs) and Fair Value Gaps (FVGs) are also useful, they have different functions and execution strategies.
Bitcoin Trading Strategy (BTC/USD)
At this stage, the primary expectation is for further Bitcoin declines. A correction may soon emerge, presenting new selling opportunities. However, the most critical event is the breakdown of the bullish structure, which had been forming for two years.
Historically, Bitcoin follows a boom-and-bust cycle, characterized by parabolic price increases followed by crashes of 80-90%. Given this historical pattern, we are preparing for a prolonged downtrend in Bitcoin.
Explanation of Key ICT Concepts in the Chart
You have already liked this post today
*The market analysis posted here is meant to increase your awareness, but not to give instructions to make a trade.
Bitcoin and Ethereum, having spent the entire weekend moving sideways within a range, surged sharply during today's Asian session. The rally was triggered by rumors that U.S. Federal Reserve Chair
Bitcoin and Ethereum remain within their sideways channels, and the inability to break out of these ranges could jeopardize the prospects for a broader recovery in the cryptocurrency market. However
After successfully exiting the Ascending Broadening Wedge pattern on the 4-hour chart of the Litecoin cryptocurrency followed by the appearance of Divergence between the Litecoin price movement and the Stochastic
Pressure on the cryptocurrency market returned yesterday after traders and investors triggered a sell-off in the U.S. stock market. As I've noted repeatedly, the correlation between these two markets
Over the past weekend, Bitcoin and Ethereum demonstrated decent resilience, maintaining a chance for further recovery. While from a technical standpoint, those chances may appear rather slim, trading within
Bitcoin and Ethereum dropped in value toward the end of Thursday's U.S. session but recovered during today's Asian trading hours. It has become common practice that the crypto market declined
InstaTrade video
analytics
Daily analytical reviews
Forex Chart
Web-version

Your IP address shows that you are currently located in the USA. If you are a resident of the United States, you are prohibited from using the services of InstaFintech Group including online trading, online transfers, deposit/withdrawal of funds, etc.
If you think you are seeing this message by mistake and your location is not the US, kindly proceed to the website. Otherwise, you must leave the website in order to comply with government restrictions.
Why does your IP address show your location as the USA?
Please confirm whether you are a US resident or not by clicking the relevant button below. If you choose the wrong option, being a US resident, you will not be able to open an account with InstaTrade anyway.
We are sorry for any inconvenience caused by this message.


