See also
On Friday, the euro closed the day up 77 pips, with the upper shadow reaching the April 2015 low, while also covering the November 2015 low. Although this resistance appears strong, the price managed to close above the MACD line, which creates the potential risk for further growth toward 1.0598.
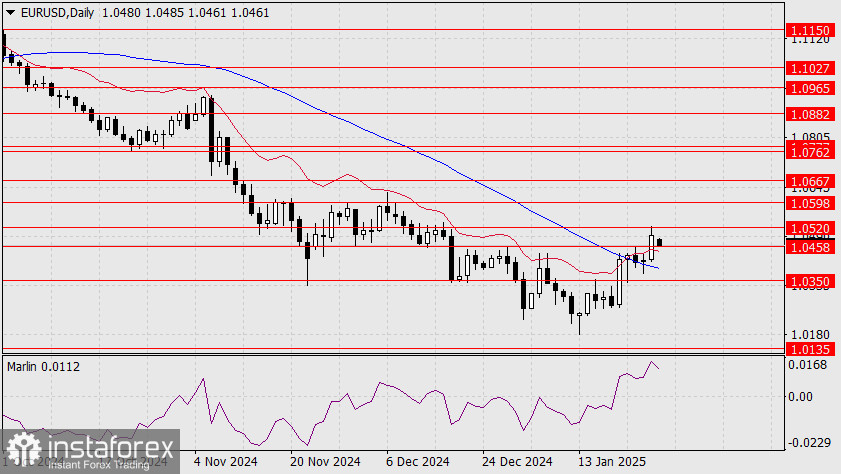
Conversely, the Marlin oscillator has entered the growth territory significantly, outpacing the price movement. This suggests that even if the price consolidates above the indicator line, it could eventually prove to be a false breakout.
Today, Germany's IFO Business Climate Index for January is forecasted to rise from 84.7 to 84.9, while new home sales in the U.S. for December are expected to increase from 664K y/y to 669K y/y. As a result, the price may remain within the range of 1.0458 to 1.0520 throughout the day.
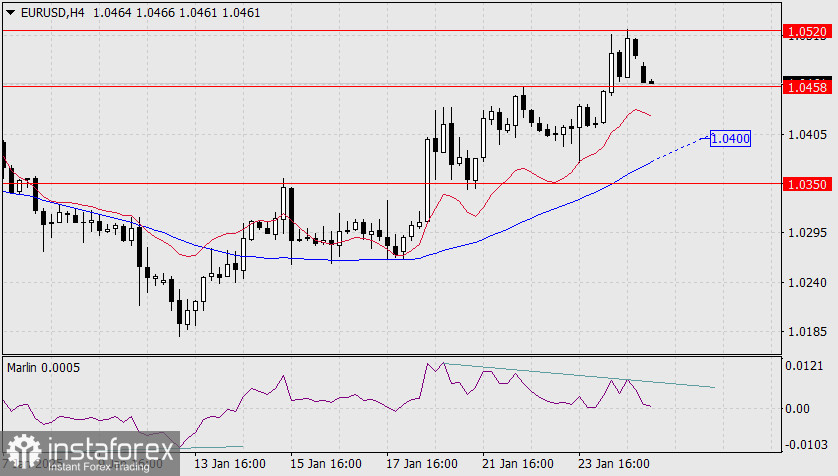
On the H4 chart, a small gap is visible at the market's opening. Additionally, a divergence has formed, and the Marlin oscillator is moving toward negative territory. However, for a successful downward push, the gap must be closed. This adds to the likelihood of sideways price movement. Another contributing factor is the anticipation of the Federal Reserve's interest rate decision on Wednesday, January 29.
You have already liked this post today
*The market analysis posted here is meant to increase your awareness, but not to give instructions to make a trade.
Early in the American session, the EUR/USD pair is trading around 1.1358 within the downtrend channel formed on April 18. The pair is under bearish pressure. We believe the instrument
Useful links: My other articles are available in this section InstaForex course for beginners Popular Analytics Open trading account Important: The begginers in forex trading need to be very careful
On the 4-hour chart, the Silver commodity instrument is visible even though its condition is strengthening where this is confirmed by the movement of the Silver price which is moving
Our trading plan for the next few hours is to sell gold below $3,333, with targets at $3,313 and $3,291. We can buy above $3,280 with short-term targets at $3,437
With the appearance of Divergence between the price movement of the AUD/JPY cross currency pair with the Stochastic Oscillator indicator and the price movement of AUD/JPY which is above
If we look at the 4-hour chart, the Gold commodity instrument appears to still be moving in a Bullish bias, but with the appearance of Divergence between the Gold price
Useful links: My other articles are available in this section InstaForex course for beginners Popular Analytics Open trading account Important: The begginers in forex trading need to be very careful
If we look at the 4-hour chart of the GBP/CHF cross currency pair, there are several interesting facts. First, the appearance of a Triangle pattern followed by the movement
Your IP address shows that you are currently located in the USA. If you are a resident of the United States, you are prohibited from using the services of InstaFintech Group including online trading, online transfers, deposit/withdrawal of funds, etc.
If you think you are seeing this message by mistake and your location is not the US, kindly proceed to the website. Otherwise, you must leave the website in order to comply with government restrictions.
Why does your IP address show your location as the USA?
Please confirm whether you are a US resident or not by clicking the relevant button below. If you choose the wrong option, being a US resident, you will not be able to open an account with InstaTrade anyway.
We are sorry for any inconvenience caused by this message.