See also
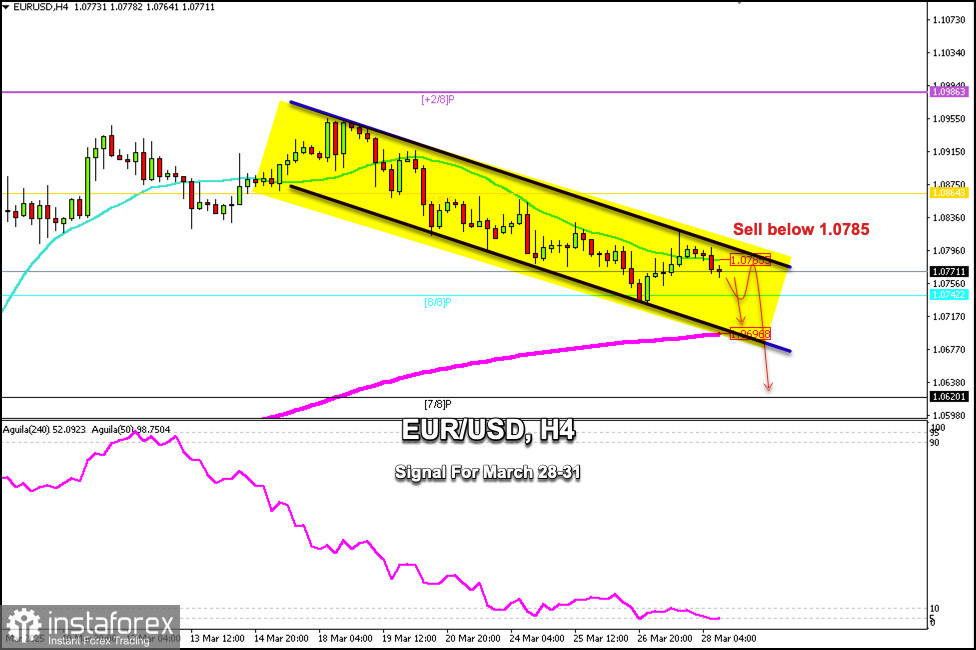
Early in the American session, the euro is trading around 1.0771, below the 21SMA, and within the downtrend channel forming since March 14. The bias is bearish.
Yesterday, EUR/USD attempted to break out of the downtrend channel and above 1.0830, but failed to consolidate its bullish strength. We now observe the continuation of the bearish movement. Hence, EUR/USD is likely to continue falling in the coming days towards the key support of the 8/8 Murray at 1.0742. The instrument could eventually reach the 7/8 Murray at 1.0620.
The euro's outlook is still bearish. We believe that the decline could continue below 1.08 in the coming days toward 1.0620.
Conversely, a sharp break and consolidation above 1.0785 could change the euro's course, and we could expect it to reach 1.0854 and eventually +2/8 Murray around 1.0986.
The H4 chart shows that the euro is under downward pressure. We reckon EUR/USD could extend its fall in the coming days. Therefore, we could look for selling opportunities.
You have already liked this post today
*The market analysis posted here is meant to increase your awareness, but not to give instructions to make a trade.
With the appearance of Divergence between the price movement of the AUD/JPY cross currency pair with the Stochastic Oscillator indicator and the price movement of AUD/JPY which is above
If we look at the 4-hour chart, the Gold commodity instrument appears to still be moving in a Bullish bias, but with the appearance of Divergence between the Gold price
Useful links: My other articles are available in this section InstaForex course for beginners Popular Analytics Open trading account Important: The begginers in forex trading need to be very careful
If we look at the 4-hour chart of the GBP/CHF cross currency pair, there are several interesting facts. First, the appearance of a Triangle pattern followed by the movement
With the price movement of the AUD/CAD cross currency pair moving above the WMA (21) which has an upward slopes and the appearance of Convergence between the price movement
The eagle indicator has reached overbought levels. However, the metal could still reach the high around 8/8 Murray, which represents a strong barrier for gold. Below this area, we could
From what is seen on the 4-hour chart, the EUR/GBP cross currency pair appears to be moving above the EMA (100), which indicates that Buyers dominate the currency pair
With the appearance of Convergence between the price movement of the main currency pair USD/JPY with the Stochastic Oscillator indicator and the position of the EMA (100) which is above
Useful links: My other articles are available in this section InstaForex course for beginners Popular Analytics Open trading account Important: The begginers in forex trading need to be very careful
Forex Chart
Web-version
Your IP address shows that you are currently located in the USA. If you are a resident of the United States, you are prohibited from using the services of InstaFintech Group including online trading, online transfers, deposit/withdrawal of funds, etc.
If you think you are seeing this message by mistake and your location is not the US, kindly proceed to the website. Otherwise, you must leave the website in order to comply with government restrictions.
Why does your IP address show your location as the USA?
Please confirm whether you are a US resident or not by clicking the relevant button below. If you choose the wrong option, being a US resident, you will not be able to open an account with InstaTrade anyway.
We are sorry for any inconvenience caused by this message.