See also


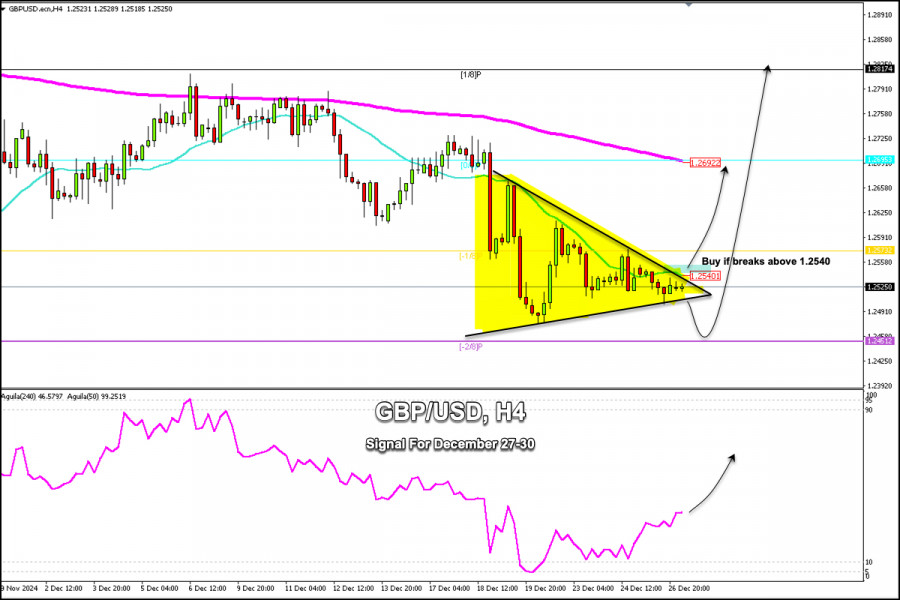
Early in the European session, the British pound (GBP/USD) was trading around 1.2525 inside the symmetrical triangle pattern and below the 21 SMA.
Since reaching the high of 1.2815 in early December, the British pound made a strong technical correction and is now located near extreme support levels. If a sharp break of the symmetrical triangle pattern occurs in the next few days, this move could define the next direction for the British pound.
If the British pound breaks and consolidates above 1.2540, we could expect it to reach 1.2560, and the 200 EMA located at 1.2692.
On the other hand, with a sharp break below the psychological level of 1.25, we could expect a technical bounce to occur around the strong support of 1.2451 which will be seen as a signal to buy.
The level we should pay attention to is the 1.2540 zone, above this zone the signal will be positive and we will buy the GBP/USD pair with the target at 1.27.
On the other hand, 1.2451 is key since around this zone we could also expect a technical rebound that will push the British pound to reach 1.27 and even 1.2817 (1/8 Murray).
You have already liked this post today
*The market analysis posted here is meant to increase your awareness, but not to give instructions to make a trade.

