See also
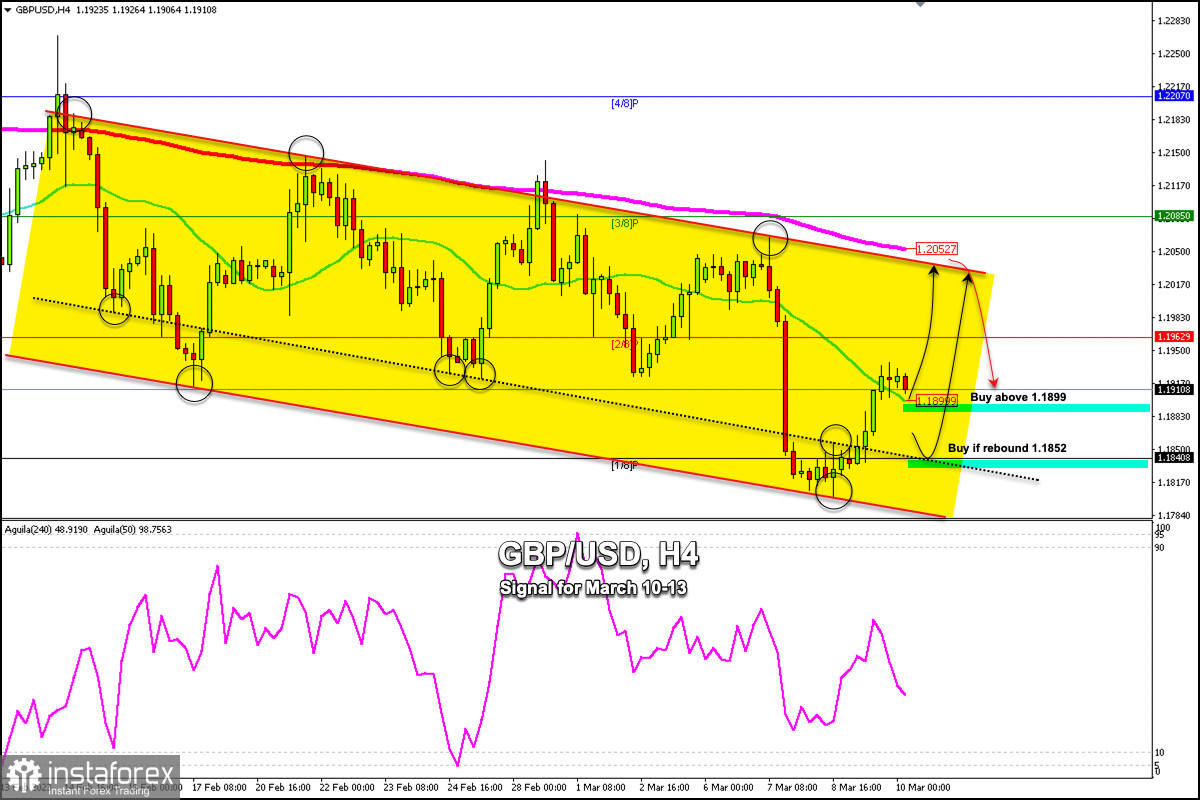
Early in the European session, the British pound is trading around 1.1910 above the 21 SMA and within the downtrend channel formed since February 13. We can see a recovery of the pair that could continue in the next few hours.
The GBP/USD pair extended the technical bounce from 1.1801 recorded on March 8. This was its lowest level since November 2023.
The 1/8 Murray line (1.1840) has become strong support for the British pound. This level gave strong bullish momentum and the instrument reached 1.1937. This was a strong support area last month, which gave GBP/USD a triple bottom and has now become strong resistance.
In case the British pound trades above 1.1899 in the next few hours, it is expected to resume its bullish cycle and the price could reach 2/8 Murray located at 1.1962 (2/8 Murray).
If the bullish force prevails, GBP/USD could reach the top of the downtrend channel around 1.2017 and finally, it could reach the 200 EMA located at 1.2052.
The US employment report will be published in the American session. It could trigger a strong volatile movement in the GBP/USD pair. Hence, we could expect it to fall to the support level of 1.1840 if the nonfarm payrolls are upbeat. On the contrary, the price could climb to the resistance zone of 1.2017.
In the next few hours, we could expect the British pound to continue to bounce. For this, we should watch the key point of 1.1840 and any technical correction above this zone could be seen as an opportunity to buy with targets at 1.2052.
You have already liked this post today
*The market analysis posted here is meant to increase your awareness, but not to give instructions to make a trade.
Useful links: My other articles are available in this section InstaForex course for beginners Popular Analytics Open trading account Important: The begginers in forex trading need to be very careful
If we look at the 4-hour chart of the GBP/CHF cross currency pair, there are several interesting facts. First, the appearance of a Triangle pattern followed by the movement
With the price movement of the AUD/CAD cross currency pair moving above the WMA (21) which has an upward slopes and the appearance of Convergence between the price movement
The eagle indicator has reached overbought levels. However, the metal could still reach the high around 8/8 Murray, which represents a strong barrier for gold. Below this area, we could
From what is seen on the 4-hour chart, the EUR/GBP cross currency pair appears to be moving above the EMA (100), which indicates that Buyers dominate the currency pair
With the appearance of Convergence between the price movement of the main currency pair USD/JPY with the Stochastic Oscillator indicator and the position of the EMA (100) which is above
Useful links: My other articles are available in this section InstaForex course for beginners Popular Analytics Open trading account Important: The begginers in forex trading need to be very careful
Forex Chart
Web-version
Your IP address shows that you are currently located in the USA. If you are a resident of the United States, you are prohibited from using the services of InstaFintech Group including online trading, online transfers, deposit/withdrawal of funds, etc.
If you think you are seeing this message by mistake and your location is not the US, kindly proceed to the website. Otherwise, you must leave the website in order to comply with government restrictions.
Why does your IP address show your location as the USA?
Please confirm whether you are a US resident or not by clicking the relevant button below. If you choose the wrong option, being a US resident, you will not be able to open an account with InstaTrade anyway.
We are sorry for any inconvenience caused by this message.