Actual patterns

Patterns are graphical models which are formed in the chart by the price. According to one of the technical analysis postulates, history (price movement) repeats itself. It means that the price movements are often similar in the same situations which makes it possible to predict the further development of the situation with a high probability.
Relevant patterns by InstaTrade is an easy-to-use service which allows you to be aware of latest changes in the market and react to clues from the market in time. In our service you will always find the latest and most relevant patterns on any pair and any timeframe.
Bearish Symmetrical Triangle
was formed on 02.04 at 09:13:40 (UTC+0)
signal strength 4 of 5
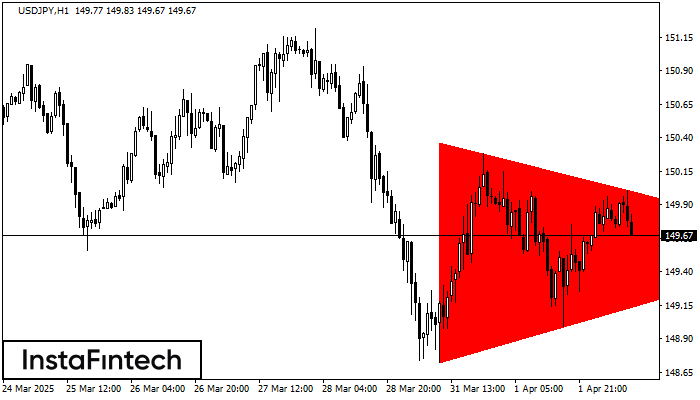
According to the chart of H1, USDJPY formed the Bearish Symmetrical Triangle pattern. Trading recommendations: A breach of the lower border 148.72 is likely to encourage a continuation of the downward trend.
- All
- All
- Bearish Rectangle
- Bearish Symmetrical Triangle
- Bearish Symmetrical Triangle
- Bullish Rectangle
- Double Top
- Double Top
- Triple Bottom
- Triple Bottom
- Triple Top
- Triple Top
- All
- All
- Buy
- Sale
- All
- 1
- 2
- 3
- 4
- 5
Triángulo Simétrico Alcista
was formed on 22.04 at 00:32:37 (UTC+0)
signal strength 1 of 5

Según el gráfico de M5, el GBPAUD formó el patrón Triángulo Simétrico Alcista. El límite inferior del patrón toca las coordenadas 2.0825/2.0852 donde el límite superior cruza 2.0880/2.0852
Los marcos de tiempo M5 y M15 pueden tener más puntos de entrada falsos.
Open chart in a new window
Triángulo Simétrico Alcista
was formed on 22.04 at 00:30:42 (UTC+0)
signal strength 1 of 5

Según el gráfico de M5, AUDCAD formó el patrón Triángulo Simétrico Alcista. Descripción: Este es el patrón de la continuación de una tendencia. 0.8879 y 0.8869 son las coordenadas
Los marcos de tiempo M5 y M15 pueden tener más puntos de entrada falsos.
Open chart in a new window
Triángulo Simétrico Bajista
was formed on 22.04 at 00:27:05 (UTC+0)
signal strength 3 of 5

Según el gráfico de M30, el USDJPY formó el patrón Triángulo Simétrico Bajista. Este patrón señala una tendencia bajista en caso de que el límite inferior 140.49 sea roto. Aquí
Open chart in a new window