实际模式

模式是通过价格在图表中形成的图形模型。 根据其中一项技术分析规定,历史(价格变动)重演。 这意味着价格变动在相同的情况下通常是相似的,这使得有可能以高概率预测情况的进一步发展。
InstaTrade的相关模式是一款易于使用的服务,可让您了解市场的最新变化并及时对市场线索做出反应。 在我们的服务中,您始终可以在任何货币对以及任何时间范围内找到最新和最相关的模式。
Bearish Symmetrical Triangle
was formed on 03.04 at 20:05:13 (UTC+0)
signal strength 1 of 5
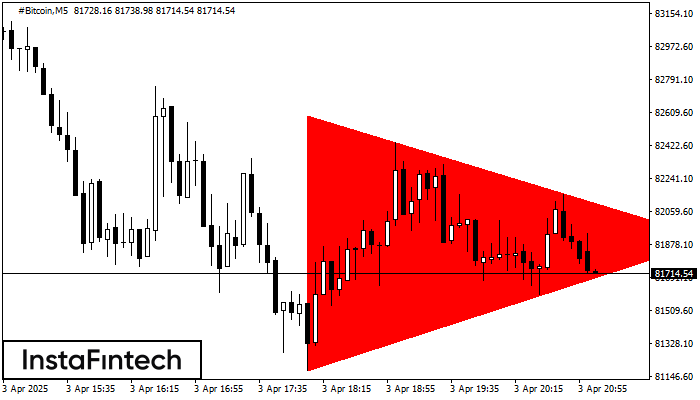
According to the chart of M5, #Bitcoin formed the Bearish Symmetrical Triangle pattern. Description: The lower border is 81178.46/81904.02 and upper border is 82588.16/81904.02. The pattern width is measured on the chart at -140970 pips. The formation of the Bearish Symmetrical Triangle pattern evidently signals a continuation of the downward trend. In other words, if the scenario comes true and #Bitcoin breaches the lower border, the price could continue its move toward 81903.87.
The M5 and M15 time frames may have more false entry points.
- All
- All
- Bearish Rectangle
- Bearish Symmetrical Triangle
- Bearish Symmetrical Triangle
- Bullish Rectangle
- Double Top
- Double Top
- Triple Bottom
- Triple Bottom
- Triple Top
- Triple Top
- All
- All
- Buy
- Sale
- All
- 1
- 2
- 3
- 4
- 5
Inverse Head dan Shoulder
was formed on 24.04 at 05:00:22 (UTC+0)
signal strength 1 of 5

Berdasarkan carta M5, AUDUSD menghasilkan corak yang dinyatakan Inverse Head dan Shoulder. Head telah ditetapkan pada 0.6353 manakala garisan median Neck ditetapkan pada 0.6368/0.6369. Pembentukan Corak Inverse Head dan Shoulder
Carta masa M5 dan M15 mungkin mempunyai lebih banyak titik kemasukan palsu.
Open chart in a new window
Triple Bottom
was formed on 24.04 at 05:00:18 (UTC+0)
signal strength 3 of 5
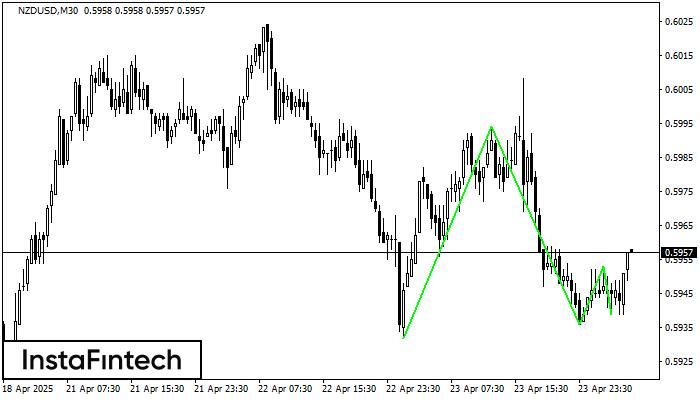
Corak Triple Bottom telah dibentuk pada carta NZDUSD M30. Ciri-ciri corak: Garisan bawah corak mempunyai koordinat 0.5994 dengan had atas 0.5994/0.5953, unjuran lebar adalah 62 mata. Pembentukan corak Triple Bottom
Open chart in a new window
Double Bottom
was formed on 24.04 at 04:31:20 (UTC+0)
signal strength 3 of 5
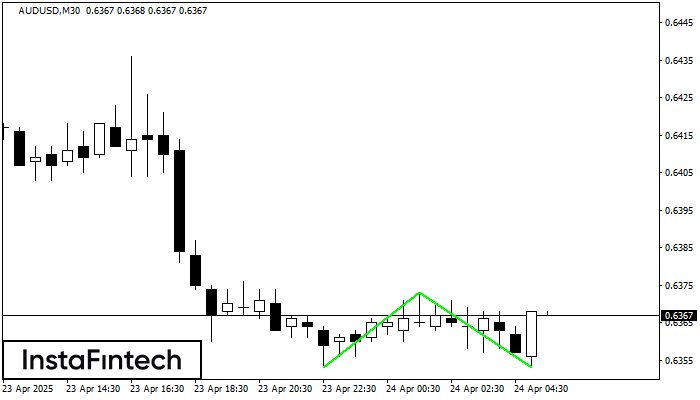
Corak Double Bottom telah dibentuk pada AUDUSD M30. Pembentukan ini menandakan pembalikan aliran dari aliran menurun ke atas. Isyarat ialah perdagangan membeli harus dibuka selepas sempadan atas corak 0.6373 telah
Open chart in a new window