অ্যাকচুয়াল প্যাটার্নস

প্যাটার্ন হলো গ্রাফিক্যাল মডেল, যা মূল্য ওঠানামার ভিত্তিতে চার্টে তৈরি হয়। টেকনিক্যাল বিশ্লেষণের নীতি অনুযায়ী, ইতিহাসের (প্রাইস মুভমেন্ট) পুনরাবৃত্তি ঘটে। অর্থাৎ, পরিস্থিতি যদি একই রকম থাকে তাহলে প্রাইস মুভমেন্টও প্রায় একই রকম হয়। এর ফলে মূল্যের ওঠানামা কেমন হবে তা আগেই থেকেই অনুমান করা যায়।
ইন্সটাফরেক্স এর প্রাসঙ্গিক প্যাটার্নসমূহ সহজেই ব্যবহার করা যায়, যার মাধ্যমে মার্কেটের সর্বশেষ পরিস্থিতি জানা যায় এবং তার উপর ভিত্তি করে সিদ্ধান্ত নেওয়া যায়। আমাদের সেবাগুলো থেকে আপনি যেকোনো পেয়ার এবং টাইমফ্রেমের জন্য সর্বশেষ এবং সবচেয়ে প্রাসঙ্গিক প্যাটার্নগুলো খুঁজে পাবেন।
Triple Top
was formed on 31.03 at 21:30:35 (UTC+0)
signal strength 1 of 5
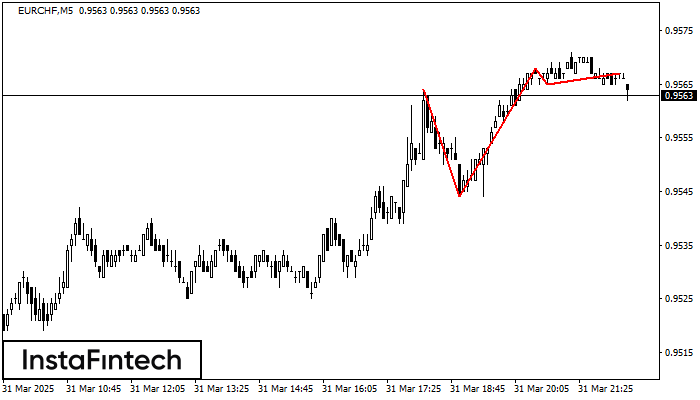
The Triple Top pattern has formed on the chart of the EURCHF M5 trading instrument. It is a reversal pattern featuring the following characteristics: resistance level -3, support level -21, and pattern’s width 20. Forecast If the price breaks through the support level 0.9544, it is likely to move further down to 0.9553.
The M5 and M15 time frames may have more false entry points.
আরও দেখুন
- All
- All
- Bearish Rectangle
- Bearish Symmetrical Triangle
- Bearish Symmetrical Triangle
- Bullish Rectangle
- Double Top
- Double Top
- Triple Bottom
- Triple Bottom
- Triple Top
- Triple Top
- All
- All
- Buy
- Sale
- All
- 1
- 2
- 3
- 4
- 5
डबल बॉटम
was formed on 22.04 at 23:05:56 (UTC+0)
signal strength 1 of 5
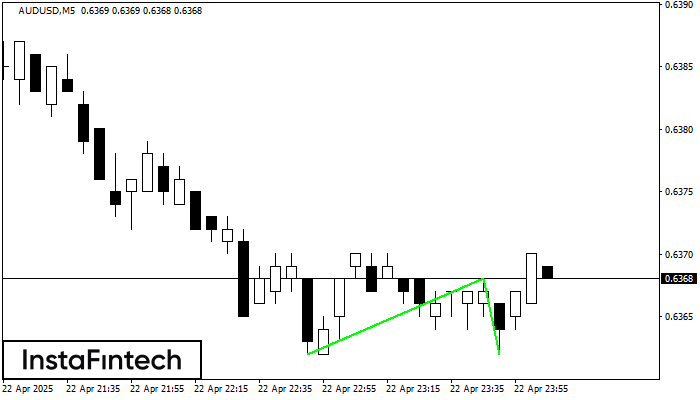
डबल बॉटम पैटर्न AUDUSD M5 पर बना है; ऊपरी सीमा 0.6368 है; निचली सीमा 0.6362 है। पैटर्न की चौड़ाई 6 अंक है। ऊपरी सीमा 0.6368 के टूटने के मामले में
M5 और M15 समय सीमा में अधिक फाल्स एंट्री पॉइंट्स हो सकते हैं।
Open chart in a new window
बुलिश पताका
was formed on 22.04 at 23:00:37 (UTC+0)
signal strength 2 of 5
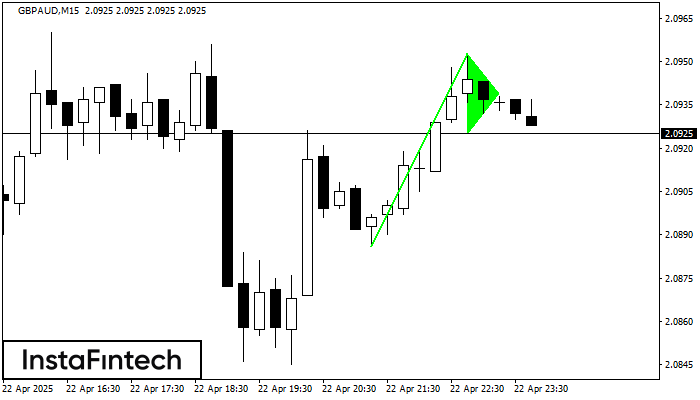
बुलिश पताका सिग्नल - ट्रेडिंग इंस्ट्रूमेंट GBPAUD M15, निरंतरता पैटर्न। पूर्वानुमान: पैटर्न के उच्च 2.0953 के ऊपर एक खरीद स्थिति सेट करना संभव है, इसके साथ अगला कदम फ्लैगपोल ऊंचाई
M5 और M15 समय सीमा में अधिक फाल्स एंट्री पॉइंट्स हो सकते हैं।
Open chart in a new window
बुलिश आयत
was formed on 22.04 at 22:14:12 (UTC+0)
signal strength 1 of 5

M5 के चार्ट के अनुसार, GBPCHF से बुलिश आयत बना जो एक प्रवृत्ति निरंतरता का पैटर्न है। पैटर्न निम्न सीमाओं के भीतर समाहित है: निचली सीमा 1.0906 – 1.0906
M5 और M15 समय सीमा में अधिक फाल्स एंट्री पॉइंट्स हो सकते हैं।
Open chart in a new window