অ্যাকচুয়াল প্যাটার্নস

প্যাটার্ন হলো গ্রাফিক্যাল মডেল, যা মূল্য ওঠানামার ভিত্তিতে চার্টে তৈরি হয়। টেকনিক্যাল বিশ্লেষণের নীতি অনুযায়ী, ইতিহাসের (প্রাইস মুভমেন্ট) পুনরাবৃত্তি ঘটে। অর্থাৎ, পরিস্থিতি যদি একই রকম থাকে তাহলে প্রাইস মুভমেন্টও প্রায় একই রকম হয়। এর ফলে মূল্যের ওঠানামা কেমন হবে তা আগেই থেকেই অনুমান করা যায়।
ইন্সটাফরেক্স এর প্রাসঙ্গিক প্যাটার্নসমূহ সহজেই ব্যবহার করা যায়, যার মাধ্যমে মার্কেটের সর্বশেষ পরিস্থিতি জানা যায় এবং তার উপর ভিত্তি করে সিদ্ধান্ত নেওয়া যায়। আমাদের সেবাগুলো থেকে আপনি যেকোনো পেয়ার এবং টাইমফ্রেমের জন্য সর্বশেষ এবং সবচেয়ে প্রাসঙ্গিক প্যাটার্নগুলো খুঁজে পাবেন।
Double Bottom
was formed on 28.03 at 02:55:06 (UTC+0)
signal strength 1 of 5
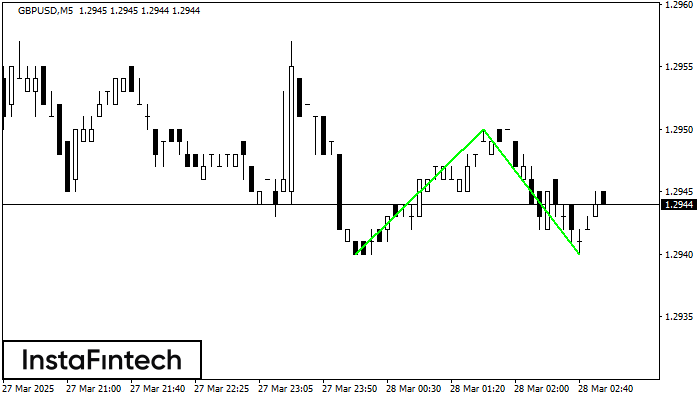
The Double Bottom pattern has been formed on GBPUSD M5. This formation signals a reversal of the trend from downwards to upwards. The signal is that a buy trade should be opened after the upper boundary of the pattern 1.2950 is broken. The further movements will rely on the width of the current pattern 10 points.
The M5 and M15 time frames may have more false entry points.
আরও দেখুন
- All
- All
- Bearish Rectangle
- Bearish Symmetrical Triangle
- Bearish Symmetrical Triangle
- Bullish Rectangle
- Double Top
- Double Top
- Triple Bottom
- Triple Bottom
- Triple Top
- Triple Top
- All
- All
- Buy
- Sale
- All
- 1
- 2
- 3
- 4
- 5
Bearish pennant
was formed on 15.04 at 03:46:46 (UTC+0)
signal strength 1 of 5

The Bearish pennant pattern has formed on the GBPAUD M5 chart. This pattern type is characterized by a slight slowdown after which the price will move in the direction
The M5 and M15 time frames may have more false entry points.
Open chart in a new window
Double Top
was formed on 15.04 at 03:00:21 (UTC+0)
signal strength 4 of 5
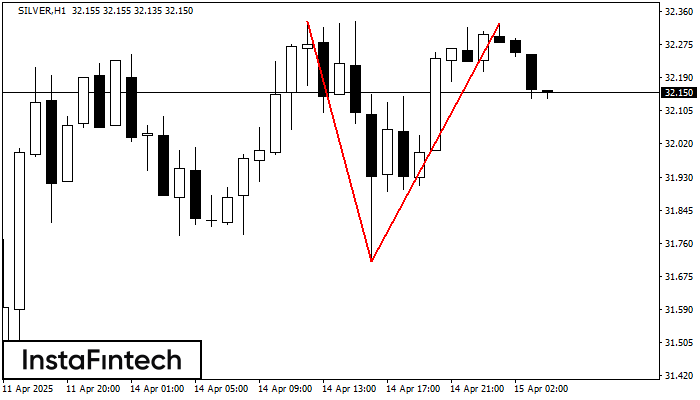
On the chart of SILVER H1 the Double Top reversal pattern has been formed. Characteristics: the upper boundary 32.33; the lower boundary 31.71; the width of the pattern 615 points
Open chart in a new window
Triple Top
was formed on 15.04 at 03:00:15 (UTC+0)
signal strength 2 of 5
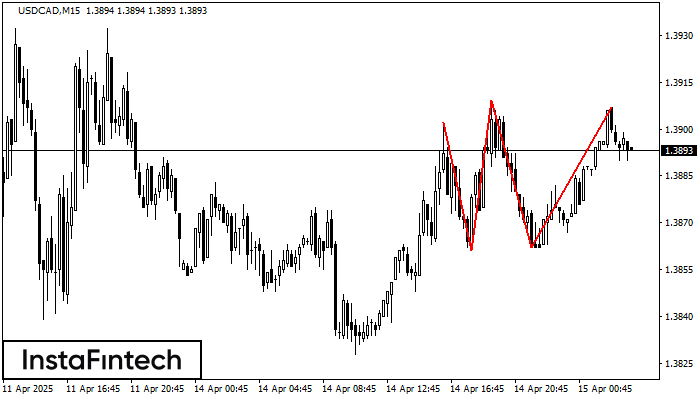
The Triple Top pattern has formed on the chart of the USDCAD M15 trading instrument. It is a reversal pattern featuring the following characteristics: resistance level -5, support level -1
The M5 and M15 time frames may have more false entry points.
Open chart in a new window