অ্যাকচুয়াল প্যাটার্নস

প্যাটার্ন হলো গ্রাফিক্যাল মডেল, যা মূল্য ওঠানামার ভিত্তিতে চার্টে তৈরি হয়। টেকনিক্যাল বিশ্লেষণের নীতি অনুযায়ী, ইতিহাসের (প্রাইস মুভমেন্ট) পুনরাবৃত্তি ঘটে। অর্থাৎ, পরিস্থিতি যদি একই রকম থাকে তাহলে প্রাইস মুভমেন্টও প্রায় একই রকম হয়। এর ফলে মূল্যের ওঠানামা কেমন হবে তা আগেই থেকেই অনুমান করা যায়।
ইন্সটাফরেক্স এর প্রাসঙ্গিক প্যাটার্নসমূহ সহজেই ব্যবহার করা যায়, যার মাধ্যমে মার্কেটের সর্বশেষ পরিস্থিতি জানা যায় এবং তার উপর ভিত্তি করে সিদ্ধান্ত নেওয়া যায়। আমাদের সেবাগুলো থেকে আপনি যেকোনো পেয়ার এবং টাইমফ্রেমের জন্য সর্বশেষ এবং সবচেয়ে প্রাসঙ্গিক প্যাটার্নগুলো খুঁজে পাবেন।
Bullish Rectangle
was formed on 26.03 at 16:52:44 (UTC+0)
signal strength 4 of 5
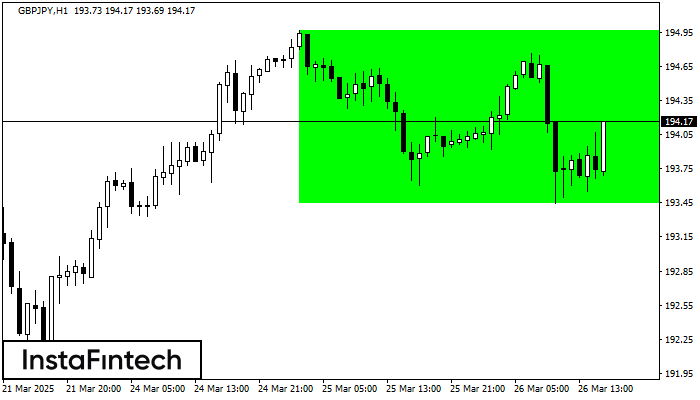
According to the chart of H1, GBPJPY formed the Bullish Rectangle which is a pattern of a trend continuation. The pattern is contained within the following borders: the lower border 193.44 – 193.44 and upper border 194.97 – 194.97. In case the upper border is broken, the instrument is likely to follow the upward trend.
- All
- All
- Bearish Rectangle
- Bearish Symmetrical Triangle
- Bearish Symmetrical Triangle
- Bullish Rectangle
- Double Top
- Double Top
- Triple Bottom
- Triple Bottom
- Triple Top
- Triple Top
- All
- All
- Buy
- Sale
- All
- 1
- 2
- 3
- 4
- 5
ডাবল বটম
was formed on 24.04 at 04:31:20 (UTC+0)
signal strength 3 of 5
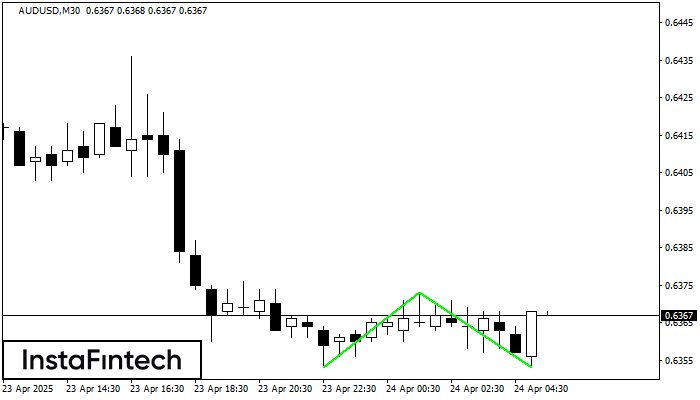
M30 চার্টে, AUDUSD-এর ডাবল বটম প্যাটার্নটি গঠিত হয়েছে। এই প্যাটার্নের গঠন এই সংকেত প্রদান করে যে মূল্য বিপরীতমুখী হয়ে নিম্নমুখী থেকে ঊর্ধ্বমুখী প্রবণতা প্রদর্শন করবে। এই প্যাটার্নের উপরের সীমানা 0.6373
Open chart in a new window
ডাবল বটম
was formed on 24.04 at 04:31:17 (UTC+0)
signal strength 2 of 5
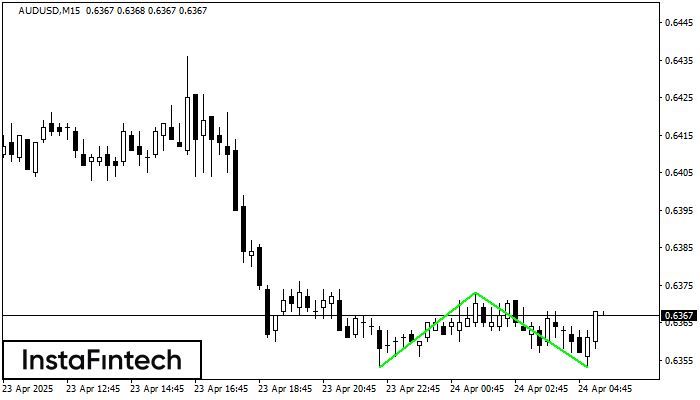
M15 চার্টে, AUDUSD-এর ডাবল বটম প্যাটার্নটি গঠিত হয়েছে। উপরের সীমানা হল 0.6373; নীচের সীমানা হল 0.6353। প্যাটার্নের প্রস্থ হল 20 পয়েন্ট। 0.6373-এর উপরের সীমানা ভেদ করার ক্ষেত্রে, প্রবণতা পরিবর্তনের পূর্বাভাস
M5 এবং M15 টাইম ফ্রেমে আরও ভুল এন্ট্রি পয়েন্ট থাকতে পারে।
Open chart in a new window
ট্রিপল টপ
was formed on 24.04 at 04:30:21 (UTC+0)
signal strength 3 of 5
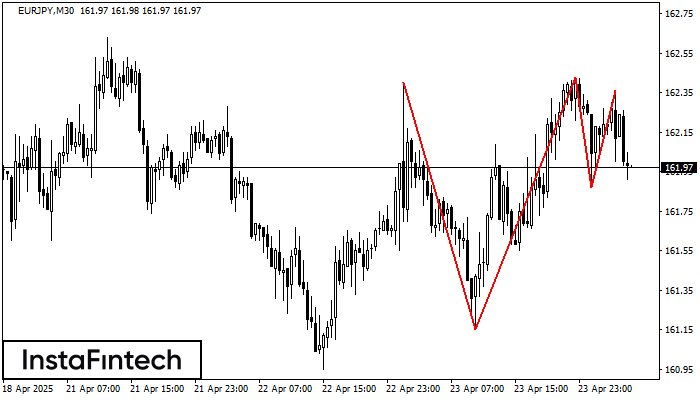
M30 চার্টে EURJPY-এর ট্রিপল টপ প্যাটার্নটি গঠিত হয়েছে। প্যাটার্নের বৈশিষ্ট্য: এই প্যাটার্নের সীমানাগুলোতে একটি ঊর্ধ্বমুখী অ্যাঙ্গেল বা কোণ আছে; প্যাটার্নের নীচের লাইনে 161.15/161.87-এর কোঅর্ডিনেট রয়েছে, উপরের সীমা 162.40/162.36; প্রস্থের প্রজেকশন
Open chart in a new window